Cuban vs Immigrants from Panama Median Female Earnings
COMPARE
Cuban
Immigrants from Panama
Median Female Earnings
Median Female Earnings Comparison
Cubans
Immigrants from Panama
$34,942
MEDIAN FEMALE EARNINGS
0.0/ 100
METRIC RATING
313th/ 347
METRIC RANK
$39,049
MEDIAN FEMALE EARNINGS
20.6/ 100
METRIC RATING
200th/ 347
METRIC RANK
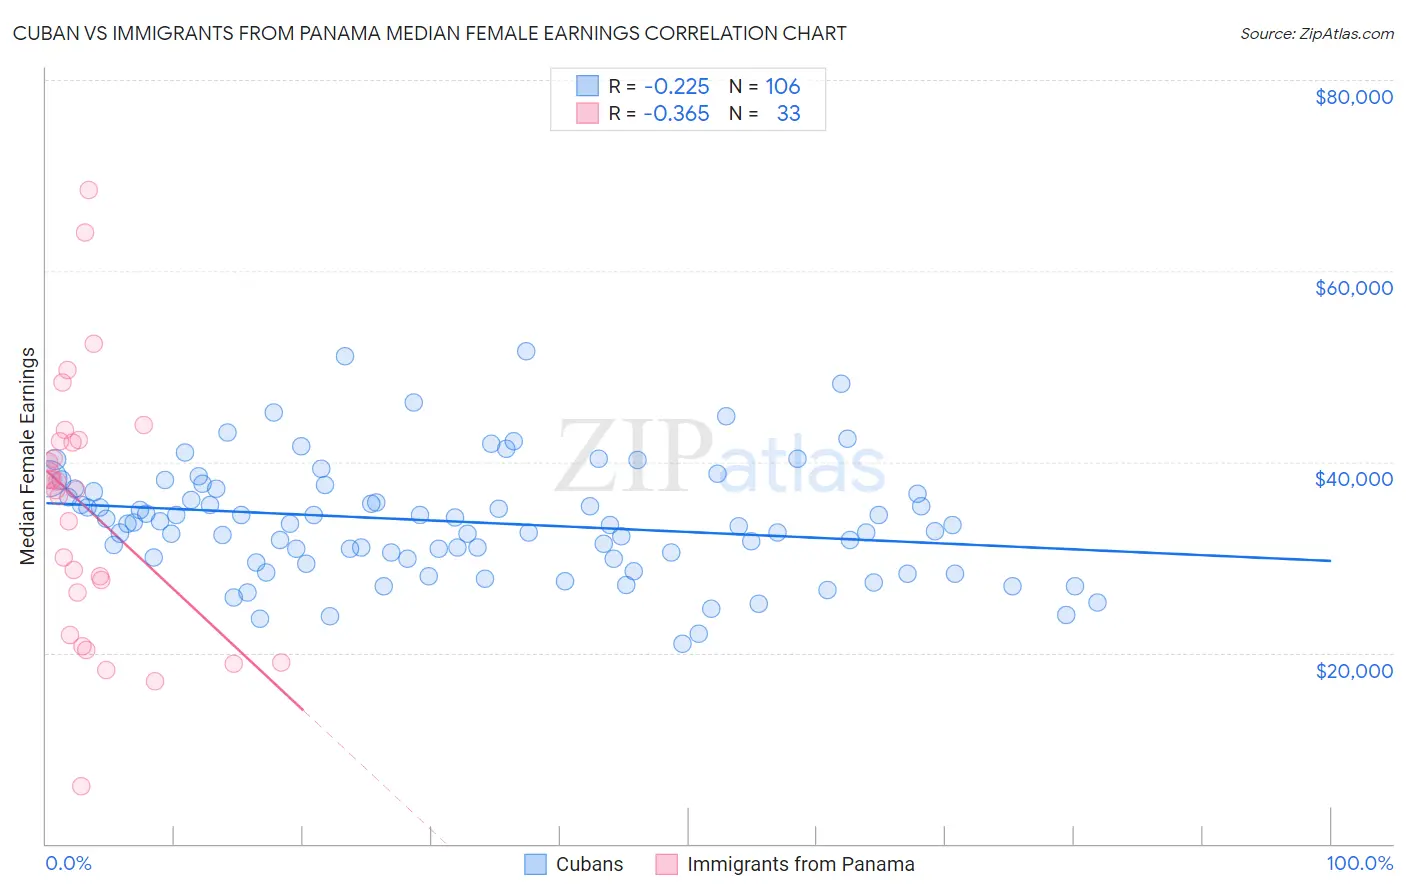
Cuban vs Immigrants from Panama Median Female Earnings Correlation Chart
The statistical analysis conducted on geographies consisting of 449,056,362 people shows a weak negative correlation between the proportion of Cubans and median female earnings in the United States with a correlation coefficient (R) of -0.225 and weighted average of $34,942. Similarly, the statistical analysis conducted on geographies consisting of 221,152,407 people shows a mild negative correlation between the proportion of Immigrants from Panama and median female earnings in the United States with a correlation coefficient (R) of -0.365 and weighted average of $39,049, a difference of 11.7%.
Median Female Earnings Correlation Summary
| Measurement | Cuban | Immigrants from Panama |
| Minimum | $20,938 | $6,075 |
| Maximum | $51,542 | $68,458 |
| Range | $30,604 | $62,383 |
| Mean | $33,741 | $35,051 |
| Median | $33,424 | $37,083 |
| Interquartile 25% (IQ1) | $29,890 | $24,068 |
| Interquartile 75% (IQ3) | $37,174 | $42,241 |
| Interquartile Range (IQR) | $7,284 | $18,172 |
| Standard Deviation (Sample) | $5,986 | $13,535 |
| Standard Deviation (Population) | $5,958 | $13,329 |
Similar Demographics by Median Female Earnings
Demographics Similar to Cubans by Median Female Earnings
In terms of median female earnings, the demographic groups most similar to Cubans are Yaqui ($34,943, a difference of 0.0%), Ute ($34,960, a difference of 0.050%), Apache ($34,895, a difference of 0.13%), Chippewa ($35,003, a difference of 0.17%), and Honduran ($35,013, a difference of 0.20%).
| Demographics | Rating | Rank | Median Female Earnings |
| Fijians | 0.0 /100 | #306 | Tragic $35,114 |
| Sioux | 0.0 /100 | #307 | Tragic $35,063 |
| Immigrants | Bahamas | 0.0 /100 | #308 | Tragic $35,027 |
| Hondurans | 0.0 /100 | #309 | Tragic $35,013 |
| Chippewa | 0.0 /100 | #310 | Tragic $35,003 |
| Ute | 0.0 /100 | #311 | Tragic $34,960 |
| Yaqui | 0.0 /100 | #312 | Tragic $34,943 |
| Cubans | 0.0 /100 | #313 | Tragic $34,942 |
| Apache | 0.0 /100 | #314 | Tragic $34,895 |
| Pennsylvania Germans | 0.0 /100 | #315 | Tragic $34,802 |
| Cherokee | 0.0 /100 | #316 | Tragic $34,742 |
| Potawatomi | 0.0 /100 | #317 | Tragic $34,739 |
| Immigrants | Yemen | 0.0 /100 | #318 | Tragic $34,693 |
| Shoshone | 0.0 /100 | #319 | Tragic $34,677 |
| Immigrants | Honduras | 0.0 /100 | #320 | Tragic $34,647 |
Demographics Similar to Immigrants from Panama by Median Female Earnings
In terms of median female earnings, the demographic groups most similar to Immigrants from Panama are Panamanian ($39,049, a difference of 0.0%), Slovak ($39,029, a difference of 0.050%), Icelander ($39,109, a difference of 0.15%), Czech ($38,992, a difference of 0.15%), and Ecuadorian ($39,117, a difference of 0.17%).
| Demographics | Rating | Rank | Median Female Earnings |
| Immigrants | Nigeria | 30.2 /100 | #193 | Fair $39,294 |
| Irish | 30.0 /100 | #194 | Fair $39,291 |
| Uruguayans | 27.3 /100 | #195 | Fair $39,228 |
| Immigrants | Costa Rica | 25.6 /100 | #196 | Fair $39,186 |
| Assyrians/Chaldeans/Syriacs | 24.6 /100 | #197 | Fair $39,159 |
| Ecuadorians | 23.0 /100 | #198 | Fair $39,117 |
| Icelanders | 22.7 /100 | #199 | Fair $39,109 |
| Immigrants | Panama | 20.6 /100 | #200 | Fair $39,049 |
| Panamanians | 20.6 /100 | #201 | Fair $39,049 |
| Slovaks | 19.9 /100 | #202 | Poor $39,029 |
| Czechs | 18.7 /100 | #203 | Poor $38,992 |
| Immigrants | Uruguay | 17.3 /100 | #204 | Poor $38,945 |
| Immigrants | Colombia | 16.3 /100 | #205 | Poor $38,913 |
| Immigrants | Bosnia and Herzegovina | 15.6 /100 | #206 | Poor $38,886 |
| Immigrants | Cambodia | 14.2 /100 | #207 | Poor $38,833 |