Cuban vs Blackfeet Median Female Earnings
COMPARE
Cuban
Blackfeet
Median Female Earnings
Median Female Earnings Comparison
Cubans
Blackfeet
$34,942
MEDIAN FEMALE EARNINGS
0.0/ 100
METRIC RATING
313th/ 347
METRIC RANK
$35,864
MEDIAN FEMALE EARNINGS
0.0/ 100
METRIC RATING
291st/ 347
METRIC RANK
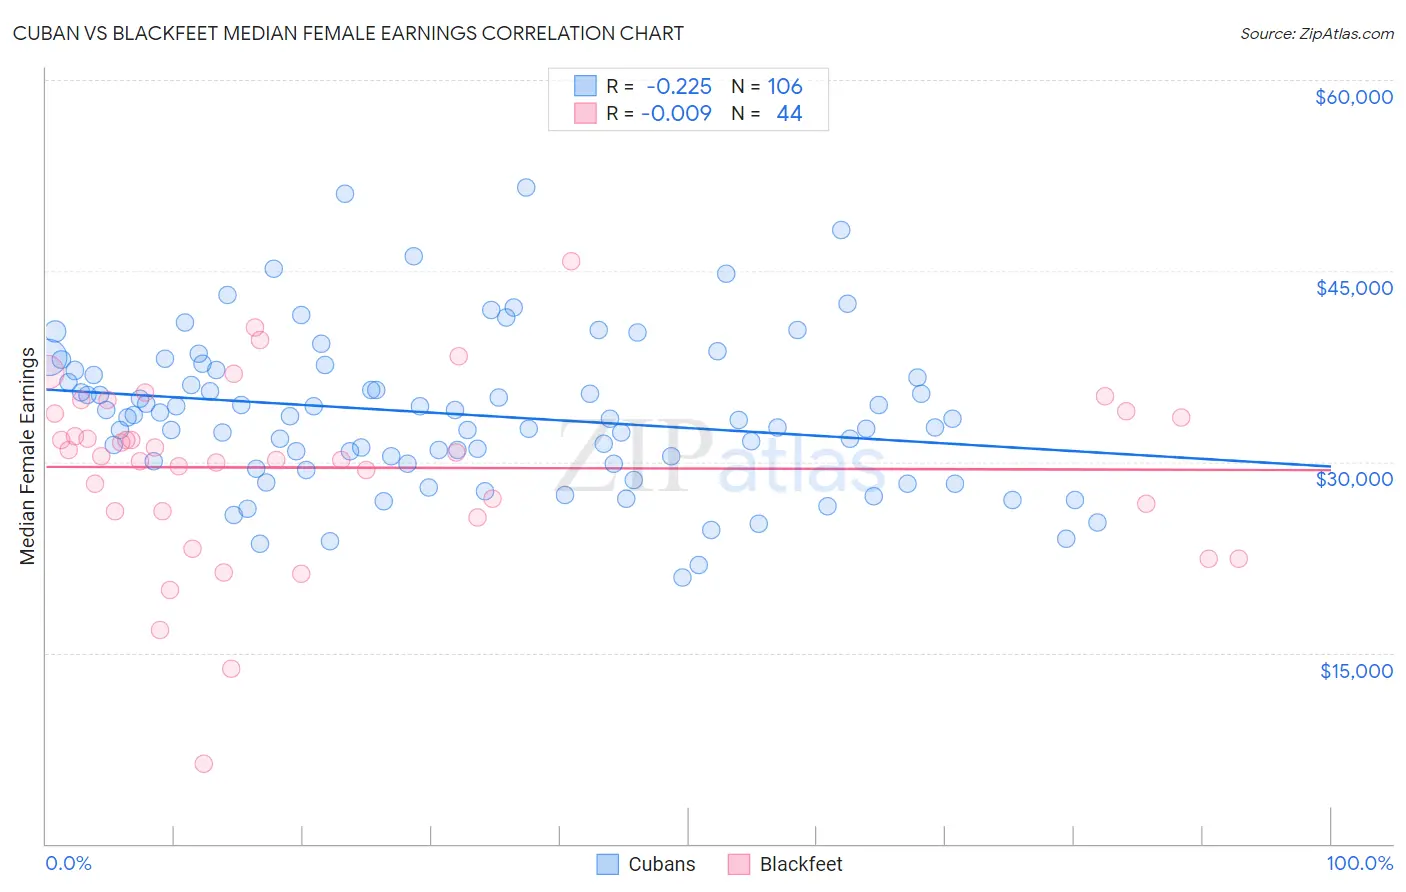
Cuban vs Blackfeet Median Female Earnings Correlation Chart
The statistical analysis conducted on geographies consisting of 449,056,362 people shows a weak negative correlation between the proportion of Cubans and median female earnings in the United States with a correlation coefficient (R) of -0.225 and weighted average of $34,942. Similarly, the statistical analysis conducted on geographies consisting of 309,402,871 people shows no correlation between the proportion of Blackfeet and median female earnings in the United States with a correlation coefficient (R) of -0.009 and weighted average of $35,864, a difference of 2.6%.
Median Female Earnings Correlation Summary
| Measurement | Cuban | Blackfeet |
| Minimum | $20,938 | $6,250 |
| Maximum | $51,542 | $45,714 |
| Range | $30,604 | $39,464 |
| Mean | $33,741 | $29,547 |
| Median | $33,424 | $30,603 |
| Interquartile 25% (IQ1) | $29,890 | $26,095 |
| Interquartile 75% (IQ3) | $37,174 | $33,875 |
| Interquartile Range (IQR) | $7,284 | $7,780 |
| Standard Deviation (Sample) | $5,986 | $7,260 |
| Standard Deviation (Population) | $5,958 | $7,177 |
Similar Demographics by Median Female Earnings
Demographics Similar to Cubans by Median Female Earnings
In terms of median female earnings, the demographic groups most similar to Cubans are Yaqui ($34,943, a difference of 0.0%), Ute ($34,960, a difference of 0.050%), Apache ($34,895, a difference of 0.13%), Chippewa ($35,003, a difference of 0.17%), and Honduran ($35,013, a difference of 0.20%).
| Demographics | Rating | Rank | Median Female Earnings |
| Fijians | 0.0 /100 | #306 | Tragic $35,114 |
| Sioux | 0.0 /100 | #307 | Tragic $35,063 |
| Immigrants | Bahamas | 0.0 /100 | #308 | Tragic $35,027 |
| Hondurans | 0.0 /100 | #309 | Tragic $35,013 |
| Chippewa | 0.0 /100 | #310 | Tragic $35,003 |
| Ute | 0.0 /100 | #311 | Tragic $34,960 |
| Yaqui | 0.0 /100 | #312 | Tragic $34,943 |
| Cubans | 0.0 /100 | #313 | Tragic $34,942 |
| Apache | 0.0 /100 | #314 | Tragic $34,895 |
| Pennsylvania Germans | 0.0 /100 | #315 | Tragic $34,802 |
| Cherokee | 0.0 /100 | #316 | Tragic $34,742 |
| Potawatomi | 0.0 /100 | #317 | Tragic $34,739 |
| Immigrants | Yemen | 0.0 /100 | #318 | Tragic $34,693 |
| Shoshone | 0.0 /100 | #319 | Tragic $34,677 |
| Immigrants | Honduras | 0.0 /100 | #320 | Tragic $34,647 |
Demographics Similar to Blackfeet by Median Female Earnings
In terms of median female earnings, the demographic groups most similar to Blackfeet are Central American Indian ($35,930, a difference of 0.18%), American ($35,777, a difference of 0.24%), Bangladeshi ($35,960, a difference of 0.27%), Immigrants from Zaire ($36,017, a difference of 0.43%), and Immigrants from Nicaragua ($36,023, a difference of 0.44%).
| Demographics | Rating | Rank | Median Female Earnings |
| Indonesians | 0.1 /100 | #284 | Tragic $36,140 |
| Paiute | 0.1 /100 | #285 | Tragic $36,056 |
| Osage | 0.0 /100 | #286 | Tragic $36,034 |
| Immigrants | Nicaragua | 0.0 /100 | #287 | Tragic $36,023 |
| Immigrants | Zaire | 0.0 /100 | #288 | Tragic $36,017 |
| Bangladeshis | 0.0 /100 | #289 | Tragic $35,960 |
| Central American Indians | 0.0 /100 | #290 | Tragic $35,930 |
| Blackfeet | 0.0 /100 | #291 | Tragic $35,864 |
| Americans | 0.0 /100 | #292 | Tragic $35,777 |
| Guatemalans | 0.0 /100 | #293 | Tragic $35,695 |
| Cheyenne | 0.0 /100 | #294 | Tragic $35,673 |
| Comanche | 0.0 /100 | #295 | Tragic $35,661 |
| Mexican American Indians | 0.0 /100 | #296 | Tragic $35,629 |
| Hmong | 0.0 /100 | #297 | Tragic $35,498 |
| Immigrants | Micronesia | 0.0 /100 | #298 | Tragic $35,477 |