Japanese vs Lumbee Median Male Earnings
COMPARE
Japanese
Lumbee
Median Male Earnings
Median Male Earnings Comparison
Japanese
Lumbee
$51,473
MEDIAN MALE EARNINGS
4.9/ 100
METRIC RATING
226th/ 347
METRIC RANK
$41,715
MEDIAN MALE EARNINGS
0.0/ 100
METRIC RATING
343rd/ 347
METRIC RANK
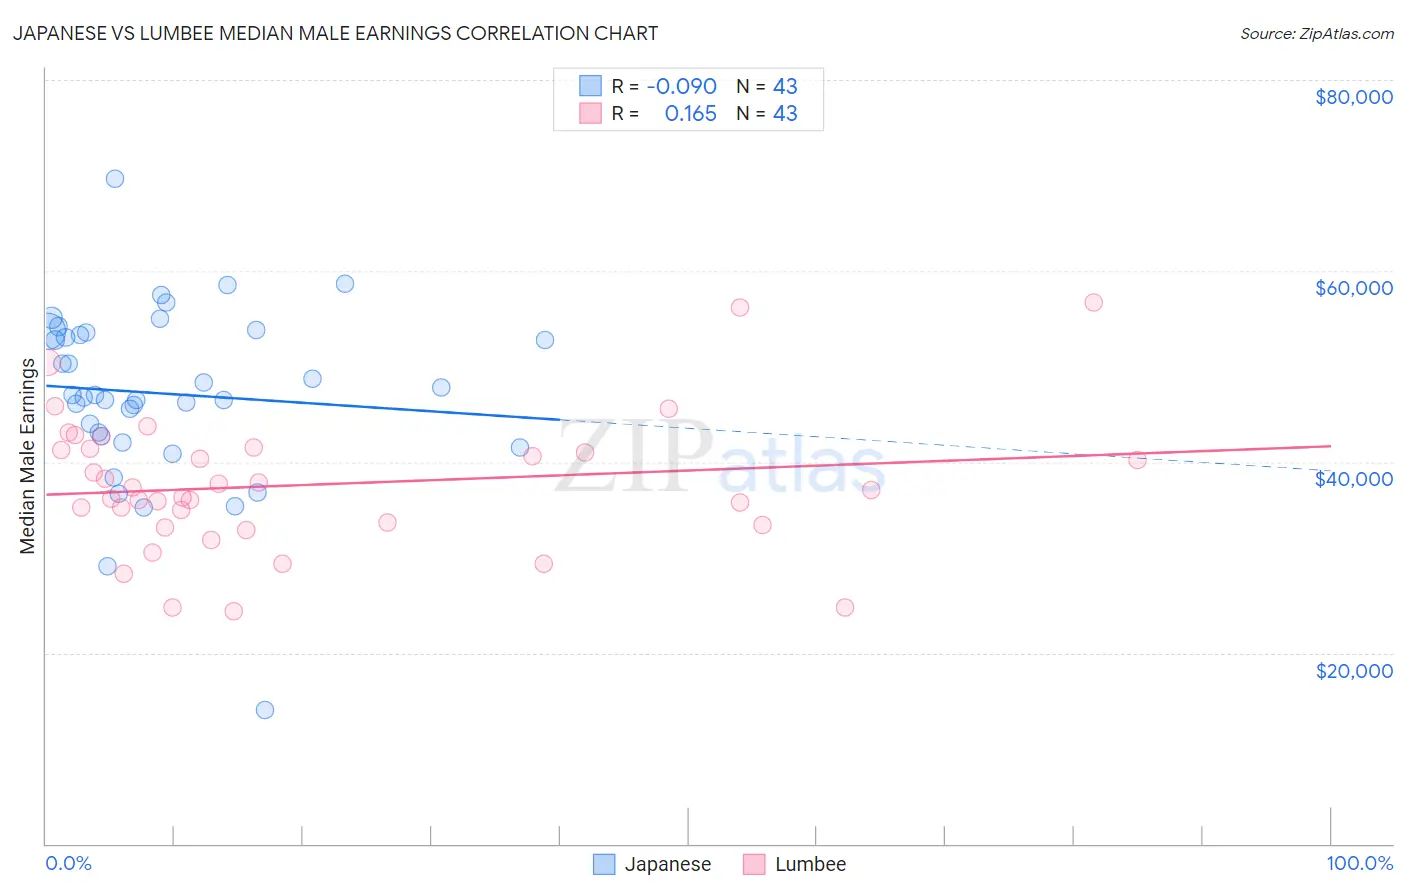
Japanese vs Lumbee Median Male Earnings Correlation Chart
The statistical analysis conducted on geographies consisting of 249,157,630 people shows a slight negative correlation between the proportion of Japanese and median male earnings in the United States with a correlation coefficient (R) of -0.090 and weighted average of $51,473. Similarly, the statistical analysis conducted on geographies consisting of 92,276,202 people shows a poor positive correlation between the proportion of Lumbee and median male earnings in the United States with a correlation coefficient (R) of 0.165 and weighted average of $41,715, a difference of 23.4%.
Median Male Earnings Correlation Summary
| Measurement | Japanese | Lumbee |
| Minimum | $14,032 | $24,297 |
| Maximum | $69,626 | $56,719 |
| Range | $55,594 | $32,422 |
| Mean | $47,153 | $37,623 |
| Median | $47,032 | $37,072 |
| Interquartile 25% (IQ1) | $42,663 | $33,323 |
| Interquartile 75% (IQ3) | $53,598 | $41,323 |
| Interquartile Range (IQR) | $10,935 | $8,000 |
| Standard Deviation (Sample) | $9,237 | $7,117 |
| Standard Deviation (Population) | $9,129 | $7,034 |
Similar Demographics by Median Male Earnings
Demographics Similar to Japanese by Median Male Earnings
In terms of median male earnings, the demographic groups most similar to Japanese are Immigrants from Sudan ($51,489, a difference of 0.030%), Trinidadian and Tobagonian ($51,446, a difference of 0.050%), Samoan ($51,389, a difference of 0.16%), Immigrants from Trinidad and Tobago ($51,376, a difference of 0.19%), and Immigrants from Cambodia ($51,594, a difference of 0.23%).
| Demographics | Rating | Rank | Median Male Earnings |
| Immigrants | Ghana | 6.9 /100 | #219 | Tragic $51,836 |
| Immigrants | Armenia | 6.6 /100 | #220 | Tragic $51,793 |
| Immigrants | Senegal | 5.8 /100 | #221 | Tragic $51,647 |
| Immigrants | Bangladesh | 5.8 /100 | #222 | Tragic $51,642 |
| Ecuadorians | 5.5 /100 | #223 | Tragic $51,596 |
| Immigrants | Cambodia | 5.5 /100 | #224 | Tragic $51,594 |
| Immigrants | Sudan | 5.0 /100 | #225 | Tragic $51,489 |
| Japanese | 4.9 /100 | #226 | Tragic $51,473 |
| Trinidadians and Tobagonians | 4.8 /100 | #227 | Tragic $51,446 |
| Samoans | 4.6 /100 | #228 | Tragic $51,389 |
| Immigrants | Trinidad and Tobago | 4.5 /100 | #229 | Tragic $51,376 |
| Immigrants | Nigeria | 4.2 /100 | #230 | Tragic $51,310 |
| Barbadians | 3.9 /100 | #231 | Tragic $51,236 |
| Sudanese | 3.9 /100 | #232 | Tragic $51,216 |
| Aleuts | 3.7 /100 | #233 | Tragic $51,168 |
Demographics Similar to Lumbee by Median Male Earnings
In terms of median male earnings, the demographic groups most similar to Lumbee are Arapaho ($41,758, a difference of 0.10%), Hopi ($42,060, a difference of 0.83%), Navajo ($42,098, a difference of 0.92%), Pueblo ($41,314, a difference of 0.97%), and Pima ($42,357, a difference of 1.5%).
| Demographics | Rating | Rank | Median Male Earnings |
| Immigrants | Congo | 0.0 /100 | #333 | Tragic $44,204 |
| Immigrants | Yemen | 0.0 /100 | #334 | Tragic $44,083 |
| Spanish American Indians | 0.0 /100 | #335 | Tragic $44,010 |
| Immigrants | Cuba | 0.0 /100 | #336 | Tragic $43,461 |
| Menominee | 0.0 /100 | #337 | Tragic $42,581 |
| Crow | 0.0 /100 | #338 | Tragic $42,434 |
| Pima | 0.0 /100 | #339 | Tragic $42,357 |
| Navajo | 0.0 /100 | #340 | Tragic $42,098 |
| Hopi | 0.0 /100 | #341 | Tragic $42,060 |
| Arapaho | 0.0 /100 | #342 | Tragic $41,758 |
| Lumbee | 0.0 /100 | #343 | Tragic $41,715 |
| Pueblo | 0.0 /100 | #344 | Tragic $41,314 |
| Puerto Ricans | 0.0 /100 | #345 | Tragic $40,071 |
| Tohono O'odham | 0.0 /100 | #346 | Tragic $39,543 |
| Yup'ik | 0.0 /100 | #347 | Tragic $39,504 |