Crow vs Immigrants from Bolivia High School Diploma
COMPARE
Crow
Immigrants from Bolivia
High School Diploma
High School Diploma Comparison
Crow
Immigrants from Bolivia
88.4%
HIGH SCHOOL DIPLOMA
10.9/ 100
METRIC RATING
215th/ 347
METRIC RANK
88.4%
HIGH SCHOOL DIPLOMA
10.3/ 100
METRIC RATING
218th/ 347
METRIC RANK
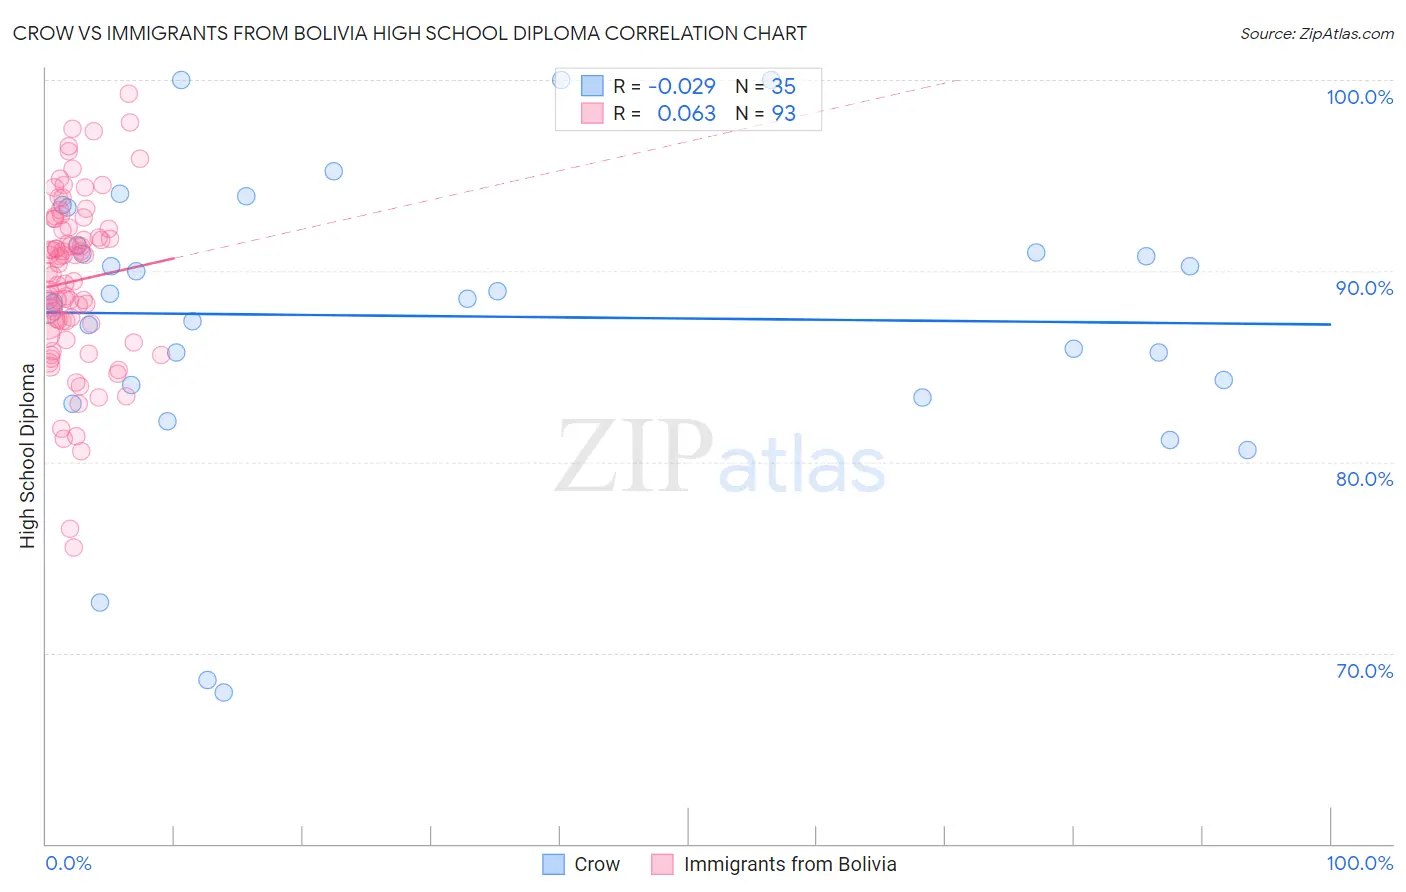
Crow vs Immigrants from Bolivia High School Diploma Correlation Chart
The statistical analysis conducted on geographies consisting of 59,209,940 people shows no correlation between the proportion of Crow and percentage of population with at least high school diploma education in the United States with a correlation coefficient (R) of -0.029 and weighted average of 88.4%. Similarly, the statistical analysis conducted on geographies consisting of 158,727,043 people shows a slight positive correlation between the proportion of Immigrants from Bolivia and percentage of population with at least high school diploma education in the United States with a correlation coefficient (R) of 0.063 and weighted average of 88.4%, a difference of 0.020%.
High School Diploma Correlation Summary
| Measurement | Crow | Immigrants from Bolivia |
| Minimum | 67.9% | 75.5% |
| Maximum | 100.0% | 99.3% |
| Range | 32.1% | 23.7% |
| Mean | 87.6% | 89.5% |
| Median | 88.6% | 89.9% |
| Interquartile 25% (IQ1) | 84.0% | 86.9% |
| Interquartile 75% (IQ3) | 91.4% | 92.3% |
| Interquartile Range (IQR) | 7.4% | 5.3% |
| Standard Deviation (Sample) | 7.5% | 4.5% |
| Standard Deviation (Population) | 7.4% | 4.4% |
Demographics Similar to Crow and Immigrants from Bolivia by High School Diploma
In terms of high school diploma, the demographic groups most similar to Crow are Immigrants from Cameroon (88.4%, a difference of 0.0%), Chickasaw (88.4%, a difference of 0.010%), Immigrants from Africa (88.4%, a difference of 0.010%), Immigrants from Somalia (88.4%, a difference of 0.020%), and South American Indian (88.5%, a difference of 0.050%). Similarly, the demographic groups most similar to Immigrants from Bolivia are Immigrants from Africa (88.4%, a difference of 0.010%), Chickasaw (88.4%, a difference of 0.020%), Immigrants from Cameroon (88.4%, a difference of 0.030%), Costa Rican (88.4%, a difference of 0.030%), and Tongan (88.4%, a difference of 0.030%).
| Demographics | Rating | Rank | High School Diploma |
| Arapaho | 16.1 /100 | #206 | Poor 88.6% |
| Immigrants | Sierra Leone | 15.8 /100 | #207 | Poor 88.6% |
| Portuguese | 14.4 /100 | #208 | Poor 88.5% |
| Cherokee | 14.3 /100 | #209 | Poor 88.5% |
| Samoans | 14.0 /100 | #210 | Poor 88.5% |
| Inupiat | 13.1 /100 | #211 | Poor 88.5% |
| South American Indians | 12.2 /100 | #212 | Poor 88.5% |
| Immigrants | Somalia | 11.3 /100 | #213 | Poor 88.4% |
| Immigrants | Cameroon | 10.9 /100 | #214 | Poor 88.4% |
| Crow | 10.9 /100 | #215 | Poor 88.4% |
| Chickasaw | 10.7 /100 | #216 | Poor 88.4% |
| Immigrants | Africa | 10.6 /100 | #217 | Poor 88.4% |
| Immigrants | Bolivia | 10.3 /100 | #218 | Poor 88.4% |
| Costa Ricans | 9.6 /100 | #219 | Tragic 88.4% |
| Tongans | 9.5 /100 | #220 | Tragic 88.4% |
| Immigrants | Afghanistan | 8.6 /100 | #221 | Tragic 88.3% |
| Colville | 7.8 /100 | #222 | Tragic 88.3% |
| Immigrants | Zaire | 7.6 /100 | #223 | Tragic 88.3% |
| Shoshone | 7.0 /100 | #224 | Tragic 88.3% |
| Creek | 6.9 /100 | #225 | Tragic 88.3% |
| Uruguayans | 5.6 /100 | #226 | Tragic 88.2% |