Crow vs Immigrants from Bolivia Single Mother Poverty
COMPARE
Crow
Immigrants from Bolivia
Single Mother Poverty
Single Mother Poverty Comparison
Crow
Immigrants from Bolivia
38.6%
SINGLE MOTHER POVERTY
0.0/ 100
METRIC RATING
339th/ 347
METRIC RANK
26.2%
SINGLE MOTHER POVERTY
100.0/ 100
METRIC RATING
21st/ 347
METRIC RANK
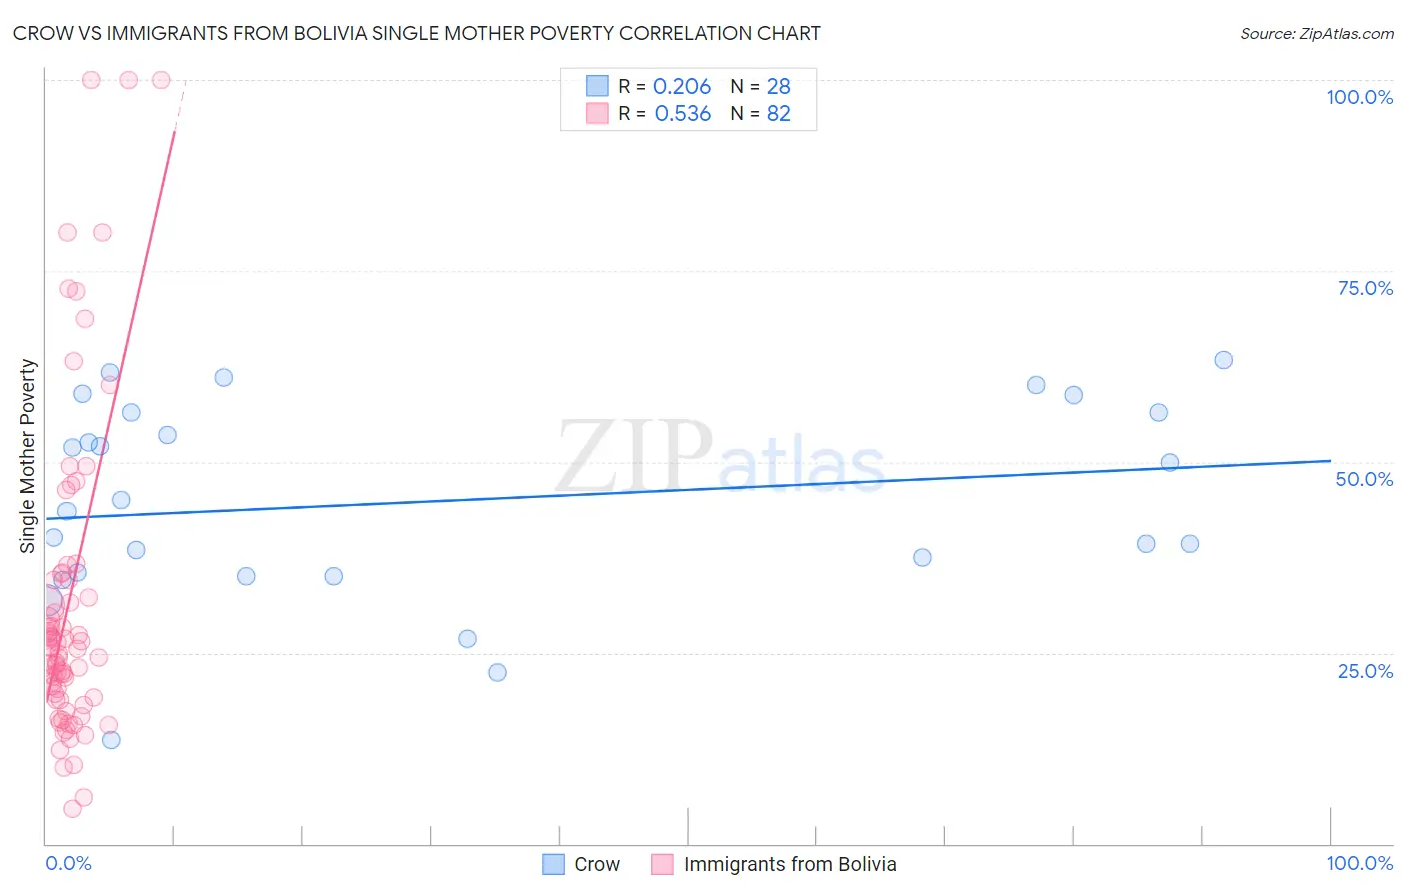
Crow vs Immigrants from Bolivia Single Mother Poverty Correlation Chart
The statistical analysis conducted on geographies consisting of 58,942,445 people shows a weak positive correlation between the proportion of Crow and poverty level among single mothers in the United States with a correlation coefficient (R) of 0.206 and weighted average of 38.6%. Similarly, the statistical analysis conducted on geographies consisting of 157,108,781 people shows a substantial positive correlation between the proportion of Immigrants from Bolivia and poverty level among single mothers in the United States with a correlation coefficient (R) of 0.536 and weighted average of 26.2%, a difference of 47.7%.
Single Mother Poverty Correlation Summary
| Measurement | Crow | Immigrants from Bolivia |
| Minimum | 13.6% | 4.6% |
| Maximum | 63.4% | 100.0% |
| Range | 49.8% | 95.4% |
| Mean | 44.8% | 31.3% |
| Median | 44.3% | 25.6% |
| Interquartile 25% (IQ1) | 35.2% | 19.2% |
| Interquartile 75% (IQ3) | 56.5% | 34.5% |
| Interquartile Range (IQR) | 21.3% | 15.2% |
| Standard Deviation (Sample) | 13.0% | 20.8% |
| Standard Deviation (Population) | 12.8% | 20.7% |
Similar Demographics by Single Mother Poverty
Demographics Similar to Crow by Single Mother Poverty
In terms of single mother poverty, the demographic groups most similar to Crow are Pima (38.6%, a difference of 0.090%), Immigrants from Yemen (38.5%, a difference of 0.30%), Cheyenne (38.5%, a difference of 0.34%), Sioux (38.8%, a difference of 0.40%), and Colville (39.3%, a difference of 1.7%).
| Demographics | Rating | Rank | Single Mother Poverty |
| Dutch West Indians | 0.0 /100 | #332 | Tragic 36.8% |
| Menominee | 0.0 /100 | #333 | Tragic 37.1% |
| Pueblo | 0.0 /100 | #334 | Tragic 37.2% |
| Yuman | 0.0 /100 | #335 | Tragic 37.8% |
| Cheyenne | 0.0 /100 | #336 | Tragic 38.5% |
| Immigrants | Yemen | 0.0 /100 | #337 | Tragic 38.5% |
| Pima | 0.0 /100 | #338 | Tragic 38.6% |
| Crow | 0.0 /100 | #339 | Tragic 38.6% |
| Sioux | 0.0 /100 | #340 | Tragic 38.8% |
| Colville | 0.0 /100 | #341 | Tragic 39.3% |
| Navajo | 0.0 /100 | #342 | Tragic 40.2% |
| Cajuns | 0.0 /100 | #343 | Tragic 40.3% |
| Tohono O'odham | 0.0 /100 | #344 | Tragic 43.0% |
| Lumbee | 0.0 /100 | #345 | Tragic 43.2% |
| Houma | 0.0 /100 | #346 | Tragic 43.5% |
Demographics Similar to Immigrants from Bolivia by Single Mother Poverty
In terms of single mother poverty, the demographic groups most similar to Immigrants from Bolivia are Immigrants from Korea (26.2%, a difference of 0.17%), Immigrants from China (26.1%, a difference of 0.19%), Immigrants from Eastern Asia (26.1%, a difference of 0.31%), Burmese (26.2%, a difference of 0.35%), and Immigrants from Moldova (26.2%, a difference of 0.37%).
| Demographics | Rating | Rank | Single Mother Poverty |
| Immigrants | Singapore | 100.0 /100 | #14 | Exceptional 25.8% |
| Immigrants | Ireland | 100.0 /100 | #15 | Exceptional 25.8% |
| Bolivians | 100.0 /100 | #16 | Exceptional 25.9% |
| Asians | 100.0 /100 | #17 | Exceptional 26.0% |
| Immigrants | Pakistan | 100.0 /100 | #18 | Exceptional 26.0% |
| Immigrants | Eastern Asia | 100.0 /100 | #19 | Exceptional 26.1% |
| Immigrants | China | 100.0 /100 | #20 | Exceptional 26.1% |
| Immigrants | Bolivia | 100.0 /100 | #21 | Exceptional 26.2% |
| Immigrants | Korea | 100.0 /100 | #22 | Exceptional 26.2% |
| Burmese | 100.0 /100 | #23 | Exceptional 26.2% |
| Immigrants | Moldova | 100.0 /100 | #24 | Exceptional 26.2% |
| Immigrants | Asia | 100.0 /100 | #25 | Exceptional 26.3% |
| Immigrants | Sri Lanka | 100.0 /100 | #26 | Exceptional 26.3% |
| Immigrants | Japan | 100.0 /100 | #27 | Exceptional 26.4% |
| Koreans | 100.0 /100 | #28 | Exceptional 26.4% |