Creek vs Ugandan College, Under 1 year
COMPARE
Creek
Ugandan
College, Under 1 year
College, Under 1 year Comparison
Creek
Ugandans
59.3%
COLLEGE, UNDER 1 YEAR
0.0/ 100
METRIC RATING
291st/ 347
METRIC RANK
66.8%
COLLEGE, UNDER 1 YEAR
87.8/ 100
METRIC RATING
136th/ 347
METRIC RANK
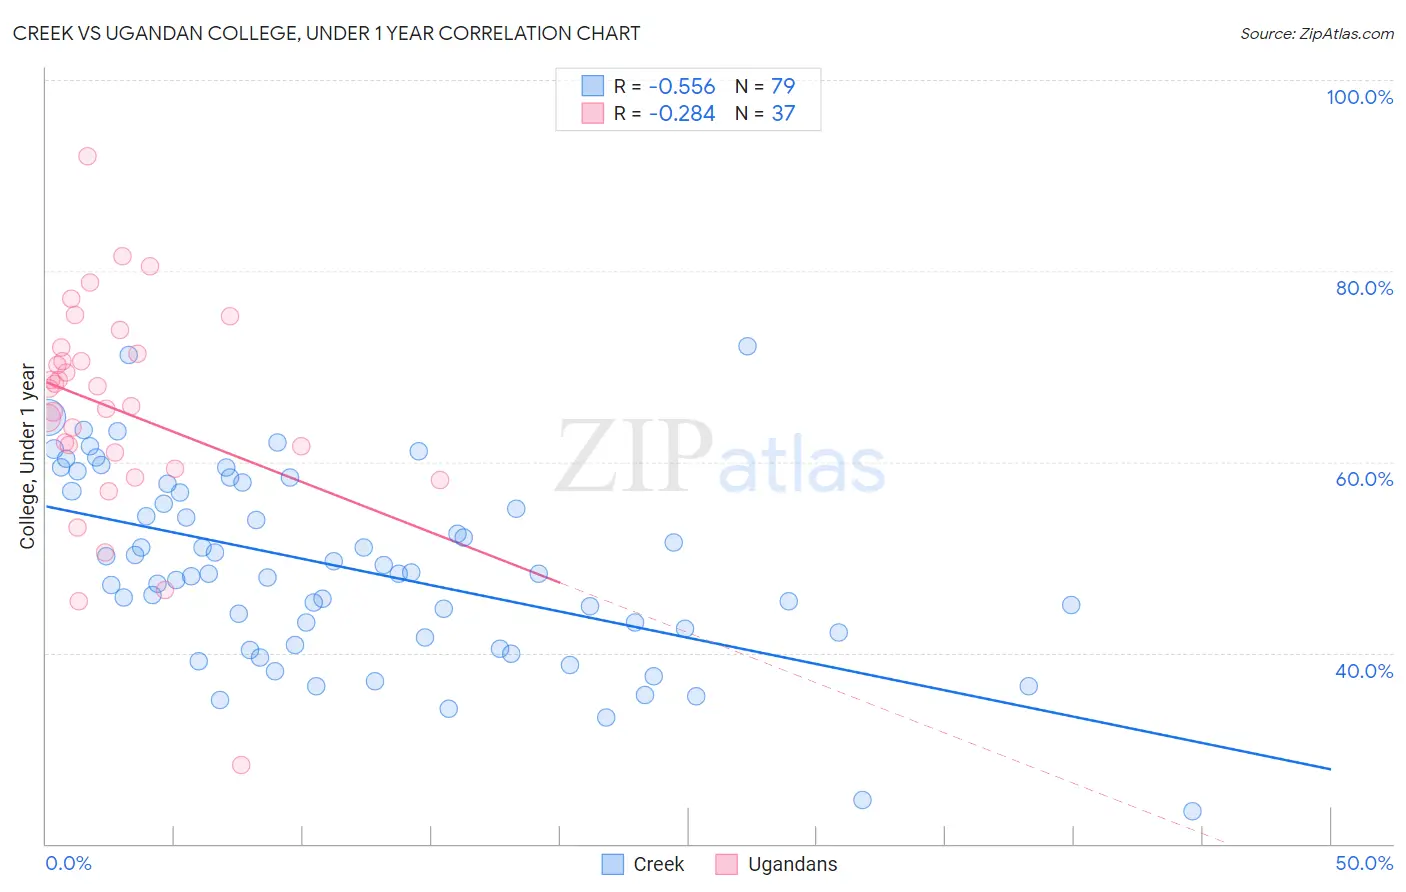
Creek vs Ugandan College, Under 1 year Correlation Chart
The statistical analysis conducted on geographies consisting of 178,480,346 people shows a substantial negative correlation between the proportion of Creek and percentage of population with at least college, under 1 year education in the United States with a correlation coefficient (R) of -0.556 and weighted average of 59.3%. Similarly, the statistical analysis conducted on geographies consisting of 94,018,576 people shows a weak negative correlation between the proportion of Ugandans and percentage of population with at least college, under 1 year education in the United States with a correlation coefficient (R) of -0.284 and weighted average of 66.8%, a difference of 12.8%.
College, Under 1 year Correlation Summary
| Measurement | Creek | Ugandan |
| Minimum | 23.4% | 28.3% |
| Maximum | 72.1% | 92.0% |
| Range | 48.7% | 63.7% |
| Mean | 48.8% | 65.6% |
| Median | 48.2% | 67.7% |
| Interquartile 25% (IQ1) | 41.6% | 60.1% |
| Interquartile 75% (IQ3) | 57.0% | 71.7% |
| Interquartile Range (IQR) | 15.4% | 11.5% |
| Standard Deviation (Sample) | 9.9% | 11.5% |
| Standard Deviation (Population) | 9.8% | 11.3% |
Similar Demographics by College, Under 1 year
Demographics Similar to Creek by College, Under 1 year
In terms of college, under 1 year, the demographic groups most similar to Creek are Nicaraguan (59.2%, a difference of 0.040%), Ecuadorian (59.3%, a difference of 0.090%), Choctaw (59.3%, a difference of 0.13%), Black/African American (59.4%, a difference of 0.20%), and Seminole (59.1%, a difference of 0.23%).
| Demographics | Rating | Rank | College, Under 1 year |
| Immigrants | St. Vincent and the Grenadines | 0.0 /100 | #284 | Tragic 59.6% |
| Paiute | 0.0 /100 | #285 | Tragic 59.6% |
| British West Indians | 0.0 /100 | #286 | Tragic 59.5% |
| Sioux | 0.0 /100 | #287 | Tragic 59.4% |
| Blacks/African Americans | 0.0 /100 | #288 | Tragic 59.4% |
| Choctaw | 0.0 /100 | #289 | Tragic 59.3% |
| Ecuadorians | 0.0 /100 | #290 | Tragic 59.3% |
| Creek | 0.0 /100 | #291 | Tragic 59.3% |
| Nicaraguans | 0.0 /100 | #292 | Tragic 59.2% |
| Seminole | 0.0 /100 | #293 | Tragic 59.1% |
| Immigrants | Belize | 0.0 /100 | #294 | Tragic 59.1% |
| Immigrants | Grenada | 0.0 /100 | #295 | Tragic 59.1% |
| Central American Indians | 0.0 /100 | #296 | Tragic 59.0% |
| Guyanese | 0.0 /100 | #297 | Tragic 59.0% |
| Immigrants | Ecuador | 0.0 /100 | #298 | Tragic 58.7% |
Demographics Similar to Ugandans by College, Under 1 year
In terms of college, under 1 year, the demographic groups most similar to Ugandans are Canadian (66.8%, a difference of 0.010%), Iraqi (66.8%, a difference of 0.020%), Immigrants from Chile (66.8%, a difference of 0.040%), Immigrants from Brazil (66.9%, a difference of 0.050%), and Polish (66.9%, a difference of 0.070%).
| Demographics | Rating | Rank | College, Under 1 year |
| Immigrants | Eastern Africa | 89.5 /100 | #129 | Excellent 67.0% |
| Immigrants | Syria | 89.0 /100 | #130 | Excellent 66.9% |
| Finns | 88.6 /100 | #131 | Excellent 66.9% |
| Poles | 88.4 /100 | #132 | Excellent 66.9% |
| Immigrants | Brazil | 88.3 /100 | #133 | Excellent 66.9% |
| Iraqis | 88.0 /100 | #134 | Excellent 66.8% |
| Canadians | 87.9 /100 | #135 | Excellent 66.8% |
| Ugandans | 87.8 /100 | #136 | Excellent 66.8% |
| Immigrants | Chile | 87.4 /100 | #137 | Excellent 66.8% |
| Immigrants | Italy | 86.9 /100 | #138 | Excellent 66.8% |
| Venezuelans | 85.9 /100 | #139 | Excellent 66.7% |
| Slavs | 85.9 /100 | #140 | Excellent 66.7% |
| Immigrants | Afghanistan | 85.1 /100 | #141 | Excellent 66.7% |
| English | 82.9 /100 | #142 | Excellent 66.6% |
| Immigrants | Uganda | 82.8 /100 | #143 | Excellent 66.5% |