Creek vs Immigrants from Portugal Median Earnings
COMPARE
Creek
Immigrants from Portugal
Median Earnings
Median Earnings Comparison
Creek
Immigrants from Portugal
$39,648
MEDIAN EARNINGS
0.0/ 100
METRIC RATING
325th/ 347
METRIC RANK
$47,304
MEDIAN EARNINGS
77.3/ 100
METRIC RATING
154th/ 347
METRIC RANK
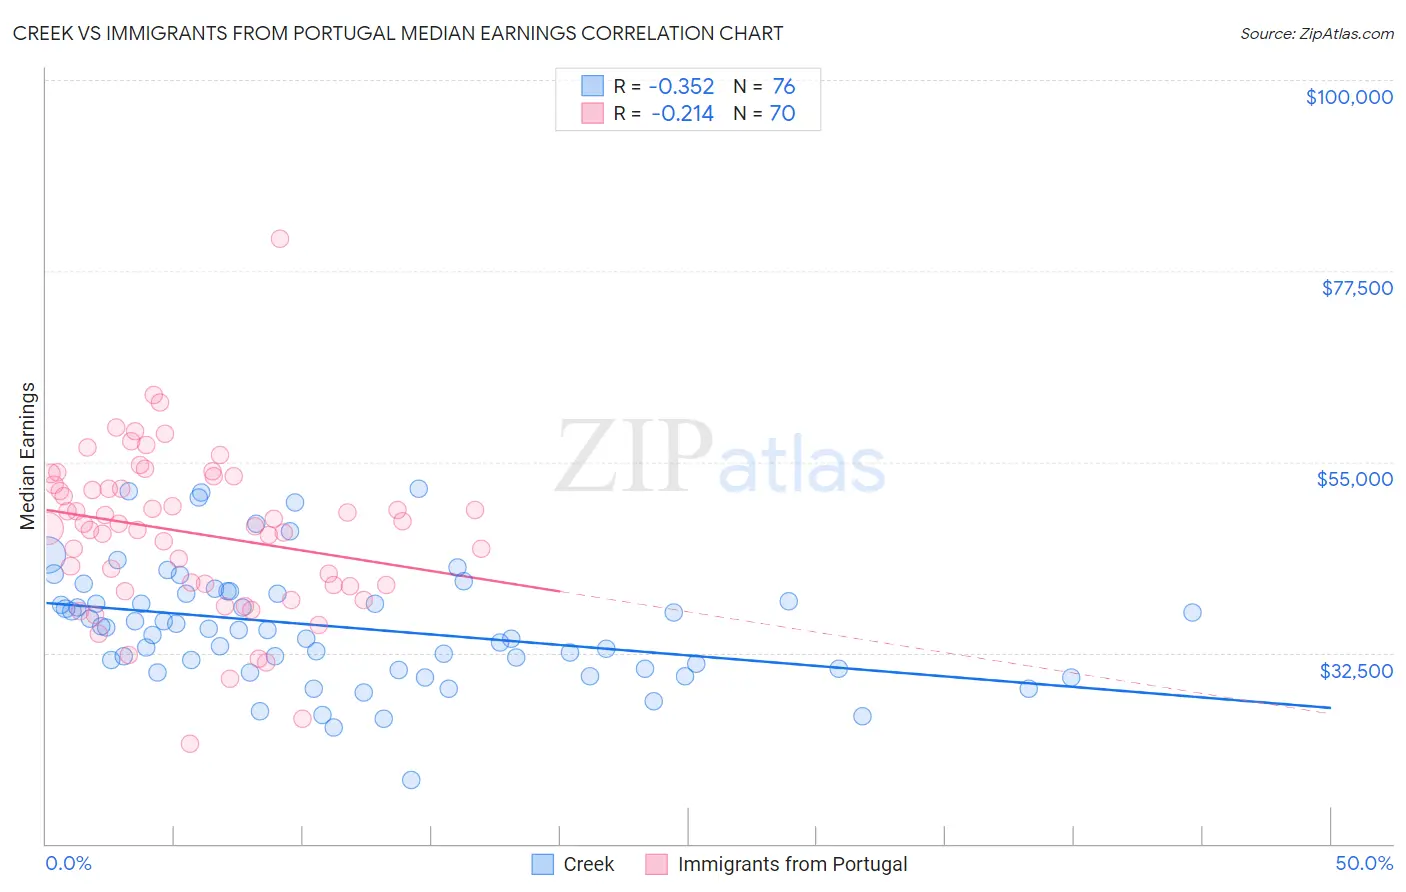
Creek vs Immigrants from Portugal Median Earnings Correlation Chart
The statistical analysis conducted on geographies consisting of 178,470,234 people shows a mild negative correlation between the proportion of Creek and median earnings in the United States with a correlation coefficient (R) of -0.352 and weighted average of $39,648. Similarly, the statistical analysis conducted on geographies consisting of 174,787,782 people shows a weak negative correlation between the proportion of Immigrants from Portugal and median earnings in the United States with a correlation coefficient (R) of -0.214 and weighted average of $47,304, a difference of 19.3%.
Median Earnings Correlation Summary
| Measurement | Creek | Immigrants from Portugal |
| Minimum | $17,500 | $21,818 |
| Maximum | $51,875 | $81,250 |
| Range | $34,375 | $59,432 |
| Mean | $35,536 | $46,644 |
| Median | $35,262 | $47,553 |
| Interquartile 25% (IQ1) | $30,664 | $40,436 |
| Interquartile 75% (IQ3) | $39,531 | $52,307 |
| Interquartile Range (IQR) | $8,868 | $11,871 |
| Standard Deviation (Sample) | $6,944 | $9,540 |
| Standard Deviation (Population) | $6,899 | $9,471 |
Similar Demographics by Median Earnings
Demographics Similar to Creek by Median Earnings
In terms of median earnings, the demographic groups most similar to Creek are Ottawa ($39,721, a difference of 0.18%), Bahamian ($39,735, a difference of 0.22%), Immigrants from Yemen ($39,540, a difference of 0.27%), Immigrants from Central America ($39,762, a difference of 0.29%), and Yuman ($39,523, a difference of 0.32%).
| Demographics | Rating | Rank | Median Earnings |
| Dutch West Indians | 0.0 /100 | #318 | Tragic $40,107 |
| Blacks/African Americans | 0.0 /100 | #319 | Tragic $40,085 |
| Immigrants | Bahamas | 0.0 /100 | #320 | Tragic $39,861 |
| Mexicans | 0.0 /100 | #321 | Tragic $39,834 |
| Immigrants | Central America | 0.0 /100 | #322 | Tragic $39,762 |
| Bahamians | 0.0 /100 | #323 | Tragic $39,735 |
| Ottawa | 0.0 /100 | #324 | Tragic $39,721 |
| Creek | 0.0 /100 | #325 | Tragic $39,648 |
| Immigrants | Yemen | 0.0 /100 | #326 | Tragic $39,540 |
| Yuman | 0.0 /100 | #327 | Tragic $39,523 |
| Sioux | 0.0 /100 | #328 | Tragic $39,448 |
| Kiowa | 0.0 /100 | #329 | Tragic $39,232 |
| Immigrants | Congo | 0.0 /100 | #330 | Tragic $39,169 |
| Immigrants | Mexico | 0.0 /100 | #331 | Tragic $39,114 |
| Yakama | 0.0 /100 | #332 | Tragic $39,107 |
Demographics Similar to Immigrants from Portugal by Median Earnings
In terms of median earnings, the demographic groups most similar to Immigrants from Portugal are Immigrants from Vietnam ($47,282, a difference of 0.050%), Irish ($47,276, a difference of 0.060%), Czech ($47,221, a difference of 0.18%), Slavic ($47,470, a difference of 0.35%), and Slovak ($47,095, a difference of 0.44%).
| Demographics | Rating | Rank | Median Earnings |
| Immigrants | South Eastern Asia | 85.0 /100 | #147 | Excellent $47,671 |
| Immigrants | Eritrea | 84.8 /100 | #148 | Excellent $47,657 |
| Luxembourgers | 84.5 /100 | #149 | Excellent $47,640 |
| Peruvians | 84.2 /100 | #150 | Excellent $47,628 |
| Immigrants | Oceania | 84.1 /100 | #151 | Excellent $47,617 |
| Immigrants | Germany | 83.1 /100 | #152 | Excellent $47,566 |
| Slavs | 81.1 /100 | #153 | Excellent $47,470 |
| Immigrants | Portugal | 77.3 /100 | #154 | Good $47,304 |
| Immigrants | Vietnam | 76.7 /100 | #155 | Good $47,282 |
| Irish | 76.6 /100 | #156 | Good $47,276 |
| Czechs | 75.1 /100 | #157 | Good $47,221 |
| Slovaks | 71.7 /100 | #158 | Good $47,095 |
| Immigrants | Peru | 69.6 /100 | #159 | Good $47,025 |
| Alsatians | 69.6 /100 | #160 | Good $47,023 |
| Immigrants | Eastern Africa | 68.0 /100 | #161 | Good $46,969 |