Northern European vs Immigrants from Portugal Median Earnings
COMPARE
Northern European
Immigrants from Portugal
Median Earnings
Median Earnings Comparison
Northern Europeans
Immigrants from Portugal
$48,887
MEDIAN EARNINGS
96.9/ 100
METRIC RATING
112th/ 347
METRIC RANK
$47,304
MEDIAN EARNINGS
77.3/ 100
METRIC RATING
154th/ 347
METRIC RANK
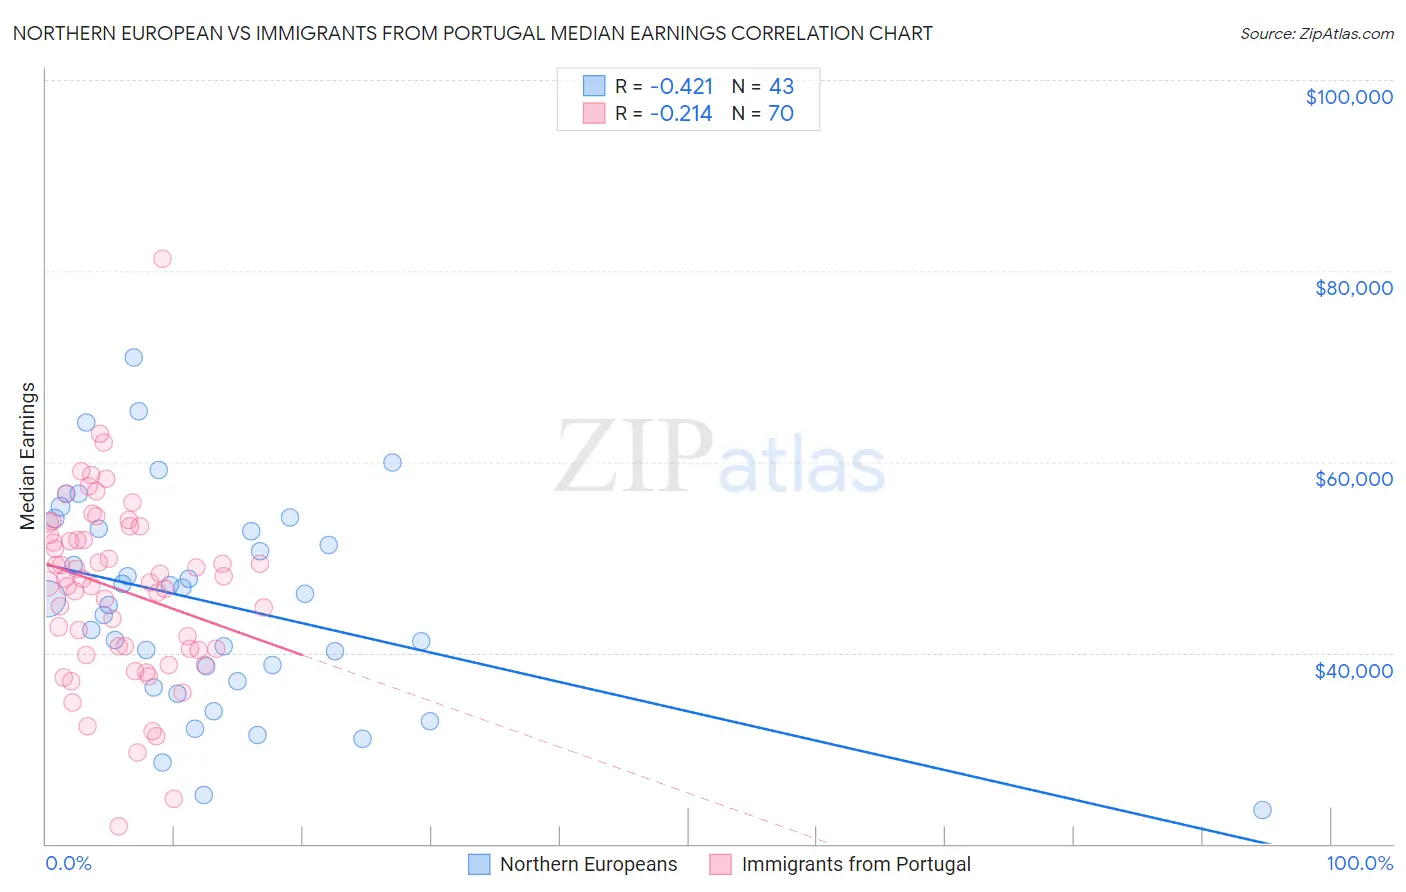
Northern European vs Immigrants from Portugal Median Earnings Correlation Chart
The statistical analysis conducted on geographies consisting of 406,030,818 people shows a moderate negative correlation between the proportion of Northern Europeans and median earnings in the United States with a correlation coefficient (R) of -0.421 and weighted average of $48,887. Similarly, the statistical analysis conducted on geographies consisting of 174,787,782 people shows a weak negative correlation between the proportion of Immigrants from Portugal and median earnings in the United States with a correlation coefficient (R) of -0.214 and weighted average of $47,304, a difference of 3.4%.
Median Earnings Correlation Summary
| Measurement | Northern European | Immigrants from Portugal |
| Minimum | $23,571 | $21,818 |
| Maximum | $70,939 | $81,250 |
| Range | $47,368 | $59,432 |
| Mean | $45,160 | $46,644 |
| Median | $45,714 | $47,553 |
| Interquartile 25% (IQ1) | $37,035 | $40,436 |
| Interquartile 75% (IQ3) | $52,998 | $52,307 |
| Interquartile Range (IQR) | $15,963 | $11,871 |
| Standard Deviation (Sample) | $10,934 | $9,540 |
| Standard Deviation (Population) | $10,806 | $9,471 |
Similar Demographics by Median Earnings
Demographics Similar to Northern Europeans by Median Earnings
In terms of median earnings, the demographic groups most similar to Northern Europeans are Immigrants from Zimbabwe ($48,913, a difference of 0.050%), Immigrants from Kuwait ($48,861, a difference of 0.050%), Immigrants from Ethiopia ($48,924, a difference of 0.070%), Syrian ($48,934, a difference of 0.10%), and Moroccan ($48,838, a difference of 0.10%).
| Demographics | Rating | Rank | Median Earnings |
| Immigrants | Western Asia | 98.4 /100 | #105 | Exceptional $49,389 |
| Immigrants | Albania | 98.4 /100 | #106 | Exceptional $49,377 |
| Immigrants | Morocco | 98.4 /100 | #107 | Exceptional $49,368 |
| Palestinians | 98.0 /100 | #108 | Exceptional $49,209 |
| Syrians | 97.1 /100 | #109 | Exceptional $48,934 |
| Immigrants | Ethiopia | 97.1 /100 | #110 | Exceptional $48,924 |
| Immigrants | Zimbabwe | 97.0 /100 | #111 | Exceptional $48,913 |
| Northern Europeans | 96.9 /100 | #112 | Exceptional $48,887 |
| Immigrants | Kuwait | 96.8 /100 | #113 | Exceptional $48,861 |
| Moroccans | 96.7 /100 | #114 | Exceptional $48,838 |
| Chinese | 96.7 /100 | #115 | Exceptional $48,836 |
| Koreans | 96.2 /100 | #116 | Exceptional $48,727 |
| Serbians | 95.9 /100 | #117 | Exceptional $48,677 |
| Immigrants | Jordan | 95.9 /100 | #118 | Exceptional $48,673 |
| Poles | 95.8 /100 | #119 | Exceptional $48,659 |
Demographics Similar to Immigrants from Portugal by Median Earnings
In terms of median earnings, the demographic groups most similar to Immigrants from Portugal are Immigrants from Vietnam ($47,282, a difference of 0.050%), Irish ($47,276, a difference of 0.060%), Czech ($47,221, a difference of 0.18%), Slavic ($47,470, a difference of 0.35%), and Slovak ($47,095, a difference of 0.44%).
| Demographics | Rating | Rank | Median Earnings |
| Immigrants | South Eastern Asia | 85.0 /100 | #147 | Excellent $47,671 |
| Immigrants | Eritrea | 84.8 /100 | #148 | Excellent $47,657 |
| Luxembourgers | 84.5 /100 | #149 | Excellent $47,640 |
| Peruvians | 84.2 /100 | #150 | Excellent $47,628 |
| Immigrants | Oceania | 84.1 /100 | #151 | Excellent $47,617 |
| Immigrants | Germany | 83.1 /100 | #152 | Excellent $47,566 |
| Slavs | 81.1 /100 | #153 | Excellent $47,470 |
| Immigrants | Portugal | 77.3 /100 | #154 | Good $47,304 |
| Immigrants | Vietnam | 76.7 /100 | #155 | Good $47,282 |
| Irish | 76.6 /100 | #156 | Good $47,276 |
| Czechs | 75.1 /100 | #157 | Good $47,221 |
| Slovaks | 71.7 /100 | #158 | Good $47,095 |
| Immigrants | Peru | 69.6 /100 | #159 | Good $47,025 |
| Alsatians | 69.6 /100 | #160 | Good $47,023 |
| Immigrants | Eastern Africa | 68.0 /100 | #161 | Good $46,969 |