Czech vs Immigrants from Portugal Median Earnings
COMPARE
Czech
Immigrants from Portugal
Median Earnings
Median Earnings Comparison
Czechs
Immigrants from Portugal
$47,221
MEDIAN EARNINGS
75.1/ 100
METRIC RATING
157th/ 347
METRIC RANK
$47,304
MEDIAN EARNINGS
77.3/ 100
METRIC RATING
154th/ 347
METRIC RANK
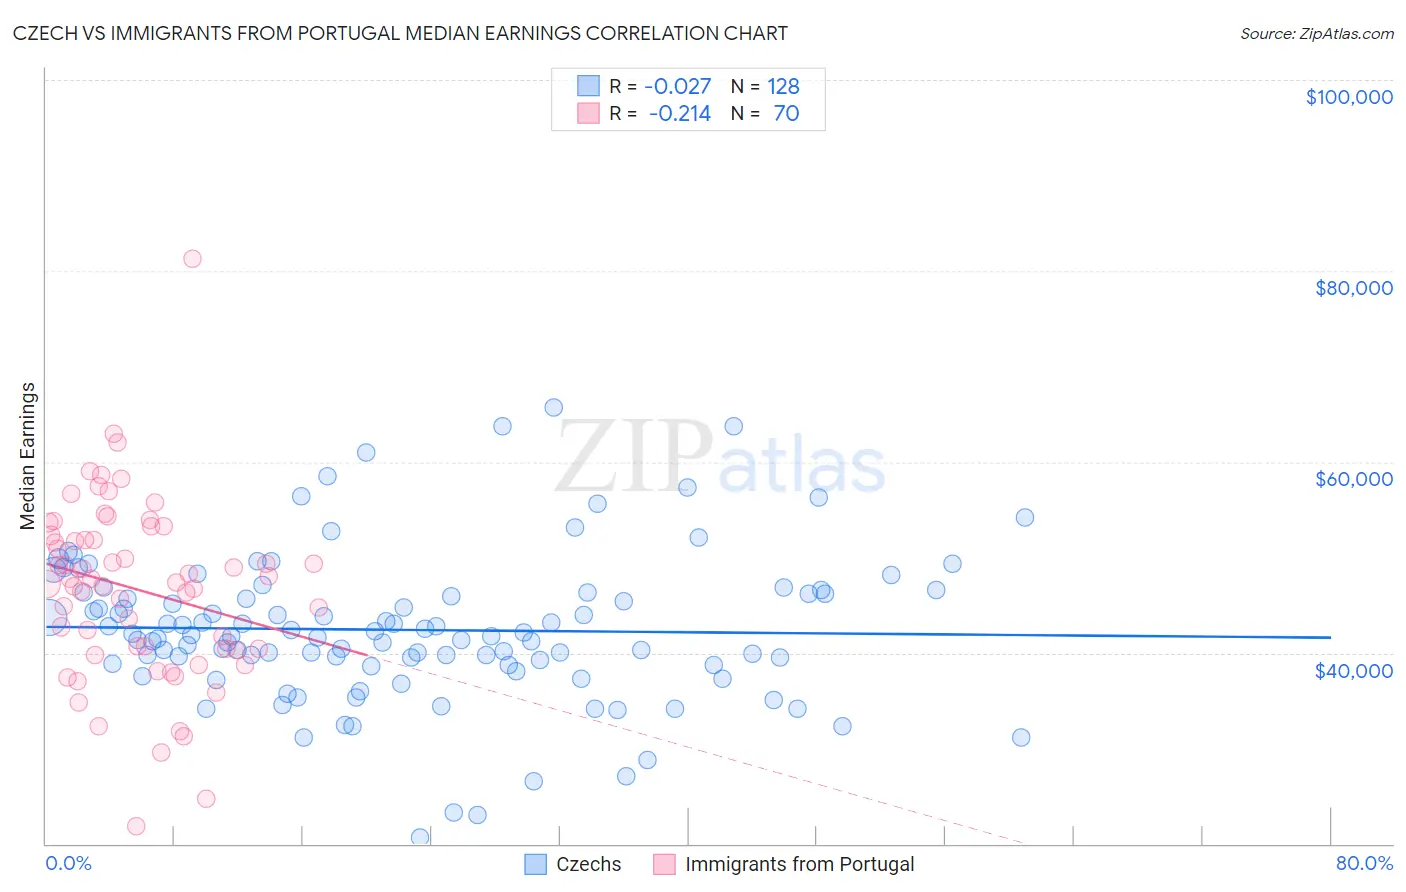
Czech vs Immigrants from Portugal Median Earnings Correlation Chart
The statistical analysis conducted on geographies consisting of 484,720,536 people shows no correlation between the proportion of Czechs and median earnings in the United States with a correlation coefficient (R) of -0.027 and weighted average of $47,221. Similarly, the statistical analysis conducted on geographies consisting of 174,787,782 people shows a weak negative correlation between the proportion of Immigrants from Portugal and median earnings in the United States with a correlation coefficient (R) of -0.214 and weighted average of $47,304, a difference of 0.18%.
Median Earnings Correlation Summary
| Measurement | Czech | Immigrants from Portugal |
| Minimum | $20,625 | $21,818 |
| Maximum | $65,656 | $81,250 |
| Range | $45,031 | $59,432 |
| Mean | $42,405 | $46,644 |
| Median | $41,812 | $47,553 |
| Interquartile 25% (IQ1) | $38,782 | $40,436 |
| Interquartile 75% (IQ3) | $46,266 | $52,307 |
| Interquartile Range (IQR) | $7,485 | $11,871 |
| Standard Deviation (Sample) | $7,742 | $9,540 |
| Standard Deviation (Population) | $7,712 | $9,471 |
Demographics Similar to Czechs and Immigrants from Portugal by Median Earnings
In terms of median earnings, the demographic groups most similar to Czechs are Irish ($47,276, a difference of 0.12%), Immigrants from Vietnam ($47,282, a difference of 0.13%), Slovak ($47,095, a difference of 0.27%), Immigrants from Peru ($47,025, a difference of 0.42%), and Alsatian ($47,023, a difference of 0.42%). Similarly, the demographic groups most similar to Immigrants from Portugal are Immigrants from Vietnam ($47,282, a difference of 0.050%), Irish ($47,276, a difference of 0.060%), Slavic ($47,470, a difference of 0.35%), Slovak ($47,095, a difference of 0.44%), and Immigrants from Germany ($47,566, a difference of 0.55%).
| Demographics | Rating | Rank | Median Earnings |
| Immigrants | Saudi Arabia | 85.6 /100 | #145 | Excellent $47,704 |
| Immigrants | Chile | 85.5 /100 | #146 | Excellent $47,697 |
| Immigrants | South Eastern Asia | 85.0 /100 | #147 | Excellent $47,671 |
| Immigrants | Eritrea | 84.8 /100 | #148 | Excellent $47,657 |
| Luxembourgers | 84.5 /100 | #149 | Excellent $47,640 |
| Peruvians | 84.2 /100 | #150 | Excellent $47,628 |
| Immigrants | Oceania | 84.1 /100 | #151 | Excellent $47,617 |
| Immigrants | Germany | 83.1 /100 | #152 | Excellent $47,566 |
| Slavs | 81.1 /100 | #153 | Excellent $47,470 |
| Immigrants | Portugal | 77.3 /100 | #154 | Good $47,304 |
| Immigrants | Vietnam | 76.7 /100 | #155 | Good $47,282 |
| Irish | 76.6 /100 | #156 | Good $47,276 |
| Czechs | 75.1 /100 | #157 | Good $47,221 |
| Slovaks | 71.7 /100 | #158 | Good $47,095 |
| Immigrants | Peru | 69.6 /100 | #159 | Good $47,025 |
| Alsatians | 69.6 /100 | #160 | Good $47,023 |
| Immigrants | Eastern Africa | 68.0 /100 | #161 | Good $46,969 |
| South American Indians | 67.4 /100 | #162 | Good $46,952 |
| Icelanders | 66.3 /100 | #163 | Good $46,916 |
| Norwegians | 64.7 /100 | #164 | Good $46,865 |
| South Americans | 62.7 /100 | #165 | Good $46,804 |