Austrian vs Immigrants from Portugal Median Earnings
COMPARE
Austrian
Immigrants from Portugal
Median Earnings
Median Earnings Comparison
Austrians
Immigrants from Portugal
$49,501
MEDIAN EARNINGS
98.7/ 100
METRIC RATING
103rd/ 347
METRIC RANK
$47,304
MEDIAN EARNINGS
77.3/ 100
METRIC RATING
154th/ 347
METRIC RANK
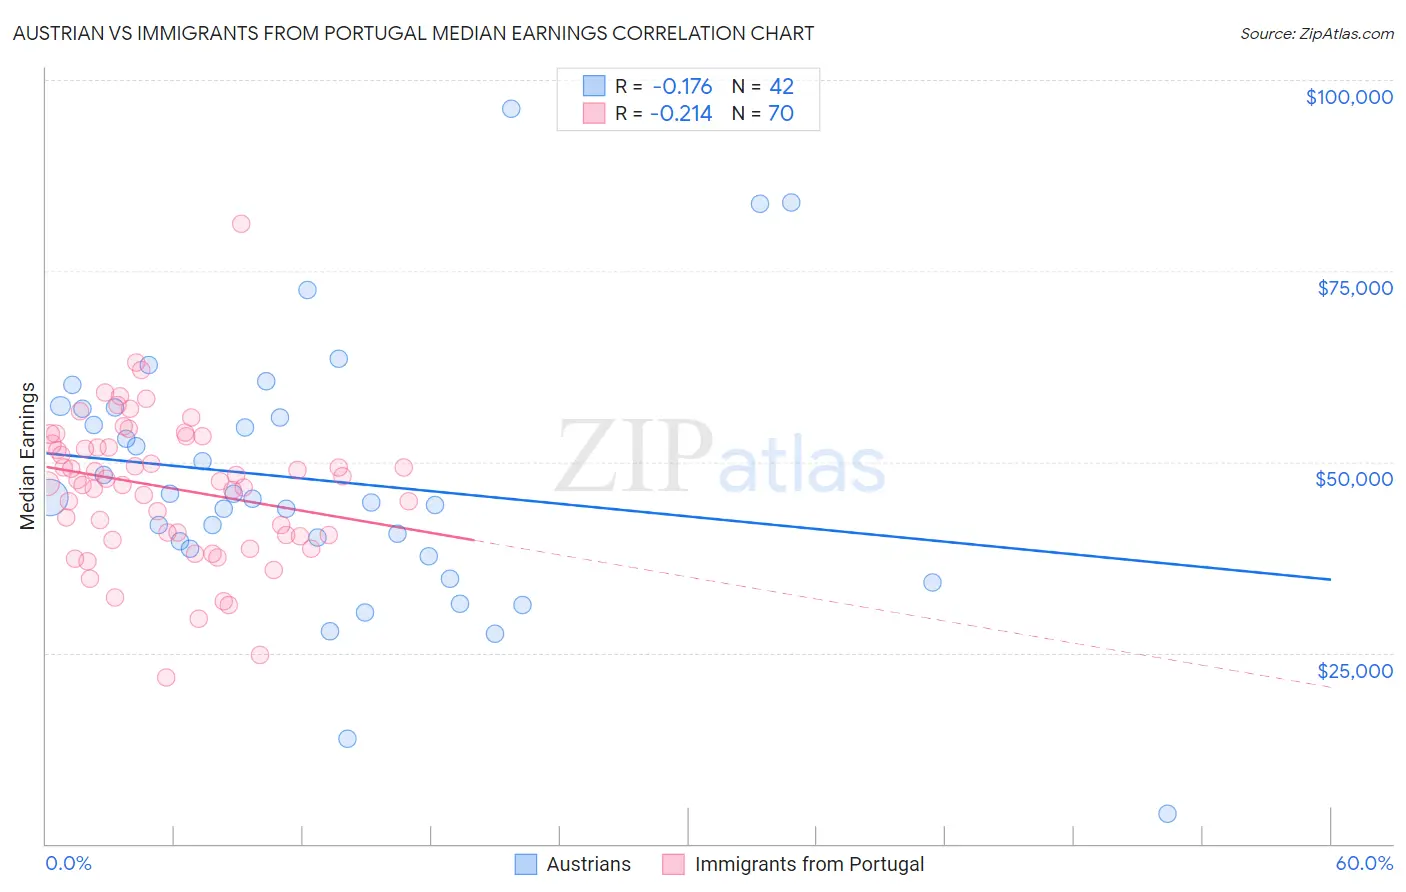
Austrian vs Immigrants from Portugal Median Earnings Correlation Chart
The statistical analysis conducted on geographies consisting of 452,042,983 people shows a poor negative correlation between the proportion of Austrians and median earnings in the United States with a correlation coefficient (R) of -0.176 and weighted average of $49,501. Similarly, the statistical analysis conducted on geographies consisting of 174,787,782 people shows a weak negative correlation between the proportion of Immigrants from Portugal and median earnings in the United States with a correlation coefficient (R) of -0.214 and weighted average of $47,304, a difference of 4.6%.
Median Earnings Correlation Summary
| Measurement | Austrian | Immigrants from Portugal |
| Minimum | $3,902 | $21,818 |
| Maximum | $96,250 | $81,250 |
| Range | $92,348 | $59,432 |
| Mean | $47,542 | $46,644 |
| Median | $45,255 | $47,553 |
| Interquartile 25% (IQ1) | $38,609 | $40,436 |
| Interquartile 75% (IQ3) | $56,967 | $52,307 |
| Interquartile Range (IQR) | $18,358 | $11,871 |
| Standard Deviation (Sample) | $17,409 | $9,540 |
| Standard Deviation (Population) | $17,200 | $9,471 |
Similar Demographics by Median Earnings
Demographics Similar to Austrians by Median Earnings
In terms of median earnings, the demographic groups most similar to Austrians are Immigrants from Brazil ($49,463, a difference of 0.080%), Ethiopian ($49,572, a difference of 0.14%), Immigrants from Western Asia ($49,389, a difference of 0.23%), Immigrants from Albania ($49,377, a difference of 0.25%), and Immigrants from Poland ($49,633, a difference of 0.27%).
| Demographics | Rating | Rank | Median Earnings |
| Immigrants | Lebanon | 99.0 /100 | #96 | Exceptional $49,682 |
| Immigrants | North Macedonia | 98.9 /100 | #97 | Exceptional $49,658 |
| Immigrants | Northern Africa | 98.9 /100 | #98 | Exceptional $49,648 |
| Immigrants | Afghanistan | 98.9 /100 | #99 | Exceptional $49,645 |
| Immigrants | Poland | 98.9 /100 | #100 | Exceptional $49,633 |
| Jordanians | 98.9 /100 | #101 | Exceptional $49,632 |
| Ethiopians | 98.8 /100 | #102 | Exceptional $49,572 |
| Austrians | 98.7 /100 | #103 | Exceptional $49,501 |
| Immigrants | Brazil | 98.6 /100 | #104 | Exceptional $49,463 |
| Immigrants | Western Asia | 98.4 /100 | #105 | Exceptional $49,389 |
| Immigrants | Albania | 98.4 /100 | #106 | Exceptional $49,377 |
| Immigrants | Morocco | 98.4 /100 | #107 | Exceptional $49,368 |
| Palestinians | 98.0 /100 | #108 | Exceptional $49,209 |
| Syrians | 97.1 /100 | #109 | Exceptional $48,934 |
| Immigrants | Ethiopia | 97.1 /100 | #110 | Exceptional $48,924 |
Demographics Similar to Immigrants from Portugal by Median Earnings
In terms of median earnings, the demographic groups most similar to Immigrants from Portugal are Immigrants from Vietnam ($47,282, a difference of 0.050%), Irish ($47,276, a difference of 0.060%), Czech ($47,221, a difference of 0.18%), Slavic ($47,470, a difference of 0.35%), and Slovak ($47,095, a difference of 0.44%).
| Demographics | Rating | Rank | Median Earnings |
| Immigrants | South Eastern Asia | 85.0 /100 | #147 | Excellent $47,671 |
| Immigrants | Eritrea | 84.8 /100 | #148 | Excellent $47,657 |
| Luxembourgers | 84.5 /100 | #149 | Excellent $47,640 |
| Peruvians | 84.2 /100 | #150 | Excellent $47,628 |
| Immigrants | Oceania | 84.1 /100 | #151 | Excellent $47,617 |
| Immigrants | Germany | 83.1 /100 | #152 | Excellent $47,566 |
| Slavs | 81.1 /100 | #153 | Excellent $47,470 |
| Immigrants | Portugal | 77.3 /100 | #154 | Good $47,304 |
| Immigrants | Vietnam | 76.7 /100 | #155 | Good $47,282 |
| Irish | 76.6 /100 | #156 | Good $47,276 |
| Czechs | 75.1 /100 | #157 | Good $47,221 |
| Slovaks | 71.7 /100 | #158 | Good $47,095 |
| Immigrants | Peru | 69.6 /100 | #159 | Good $47,025 |
| Alsatians | 69.6 /100 | #160 | Good $47,023 |
| Immigrants | Eastern Africa | 68.0 /100 | #161 | Good $46,969 |