Marshallese vs Immigrants from Portugal Median Earnings
COMPARE
Marshallese
Immigrants from Portugal
Median Earnings
Median Earnings Comparison
Marshallese
Immigrants from Portugal
$41,969
MEDIAN EARNINGS
0.2/ 100
METRIC RATING
281st/ 347
METRIC RANK
$47,304
MEDIAN EARNINGS
77.3/ 100
METRIC RATING
154th/ 347
METRIC RANK
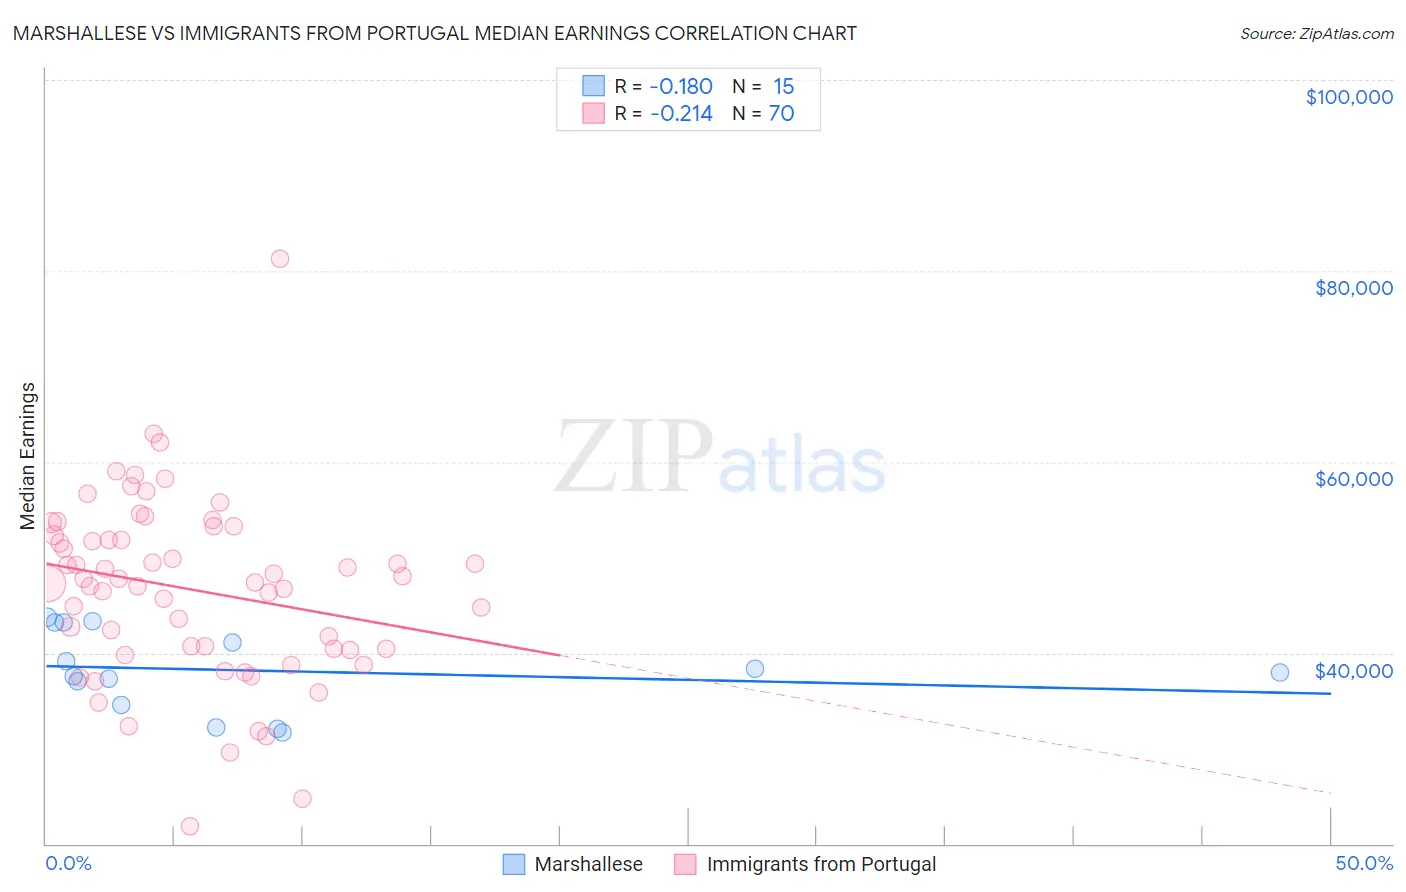
Marshallese vs Immigrants from Portugal Median Earnings Correlation Chart
The statistical analysis conducted on geographies consisting of 14,760,991 people shows a poor negative correlation between the proportion of Marshallese and median earnings in the United States with a correlation coefficient (R) of -0.180 and weighted average of $41,969. Similarly, the statistical analysis conducted on geographies consisting of 174,787,782 people shows a weak negative correlation between the proportion of Immigrants from Portugal and median earnings in the United States with a correlation coefficient (R) of -0.214 and weighted average of $47,304, a difference of 12.7%.
Median Earnings Correlation Summary
| Measurement | Marshallese | Immigrants from Portugal |
| Minimum | $31,625 | $21,818 |
| Maximum | $43,685 | $81,250 |
| Range | $12,060 | $59,432 |
| Mean | $38,147 | $46,644 |
| Median | $37,917 | $47,553 |
| Interquartile 25% (IQ1) | $34,587 | $40,436 |
| Interquartile 75% (IQ3) | $43,141 | $52,307 |
| Interquartile Range (IQR) | $8,554 | $11,871 |
| Standard Deviation (Sample) | $4,207 | $9,540 |
| Standard Deviation (Population) | $4,065 | $9,471 |
Similar Demographics by Median Earnings
Demographics Similar to Marshallese by Median Earnings
In terms of median earnings, the demographic groups most similar to Marshallese are African ($41,955, a difference of 0.030%), Dominican ($41,864, a difference of 0.25%), Hmong ($42,111, a difference of 0.34%), Blackfeet ($41,822, a difference of 0.35%), and Colville ($42,151, a difference of 0.43%).
| Demographics | Rating | Rank | Median Earnings |
| Immigrants | El Salvador | 0.4 /100 | #274 | Tragic $42,413 |
| Immigrants | Belize | 0.3 /100 | #275 | Tragic $42,339 |
| Spanish Americans | 0.3 /100 | #276 | Tragic $42,316 |
| Central Americans | 0.3 /100 | #277 | Tragic $42,280 |
| Cajuns | 0.3 /100 | #278 | Tragic $42,189 |
| Colville | 0.2 /100 | #279 | Tragic $42,151 |
| Hmong | 0.2 /100 | #280 | Tragic $42,111 |
| Marshallese | 0.2 /100 | #281 | Tragic $41,969 |
| Africans | 0.2 /100 | #282 | Tragic $41,955 |
| Dominicans | 0.2 /100 | #283 | Tragic $41,864 |
| Blackfeet | 0.2 /100 | #284 | Tragic $41,822 |
| Immigrants | Nicaragua | 0.1 /100 | #285 | Tragic $41,737 |
| Mexican American Indians | 0.1 /100 | #286 | Tragic $41,719 |
| Indonesians | 0.1 /100 | #287 | Tragic $41,701 |
| Immigrants | Dominican Republic | 0.1 /100 | #288 | Tragic $41,554 |
Demographics Similar to Immigrants from Portugal by Median Earnings
In terms of median earnings, the demographic groups most similar to Immigrants from Portugal are Immigrants from Vietnam ($47,282, a difference of 0.050%), Irish ($47,276, a difference of 0.060%), Czech ($47,221, a difference of 0.18%), Slavic ($47,470, a difference of 0.35%), and Slovak ($47,095, a difference of 0.44%).
| Demographics | Rating | Rank | Median Earnings |
| Immigrants | South Eastern Asia | 85.0 /100 | #147 | Excellent $47,671 |
| Immigrants | Eritrea | 84.8 /100 | #148 | Excellent $47,657 |
| Luxembourgers | 84.5 /100 | #149 | Excellent $47,640 |
| Peruvians | 84.2 /100 | #150 | Excellent $47,628 |
| Immigrants | Oceania | 84.1 /100 | #151 | Excellent $47,617 |
| Immigrants | Germany | 83.1 /100 | #152 | Excellent $47,566 |
| Slavs | 81.1 /100 | #153 | Excellent $47,470 |
| Immigrants | Portugal | 77.3 /100 | #154 | Good $47,304 |
| Immigrants | Vietnam | 76.7 /100 | #155 | Good $47,282 |
| Irish | 76.6 /100 | #156 | Good $47,276 |
| Czechs | 75.1 /100 | #157 | Good $47,221 |
| Slovaks | 71.7 /100 | #158 | Good $47,095 |
| Immigrants | Peru | 69.6 /100 | #159 | Good $47,025 |
| Alsatians | 69.6 /100 | #160 | Good $47,023 |
| Immigrants | Eastern Africa | 68.0 /100 | #161 | Good $46,969 |