Immigrants from Czechoslovakia vs Immigrants from Portugal Median Earnings
COMPARE
Immigrants from Czechoslovakia
Immigrants from Portugal
Median Earnings
Median Earnings Comparison
Immigrants from Czechoslovakia
Immigrants from Portugal
$52,361
MEDIAN EARNINGS
100.0/ 100
METRIC RATING
45th/ 347
METRIC RANK
$47,304
MEDIAN EARNINGS
77.3/ 100
METRIC RATING
154th/ 347
METRIC RANK
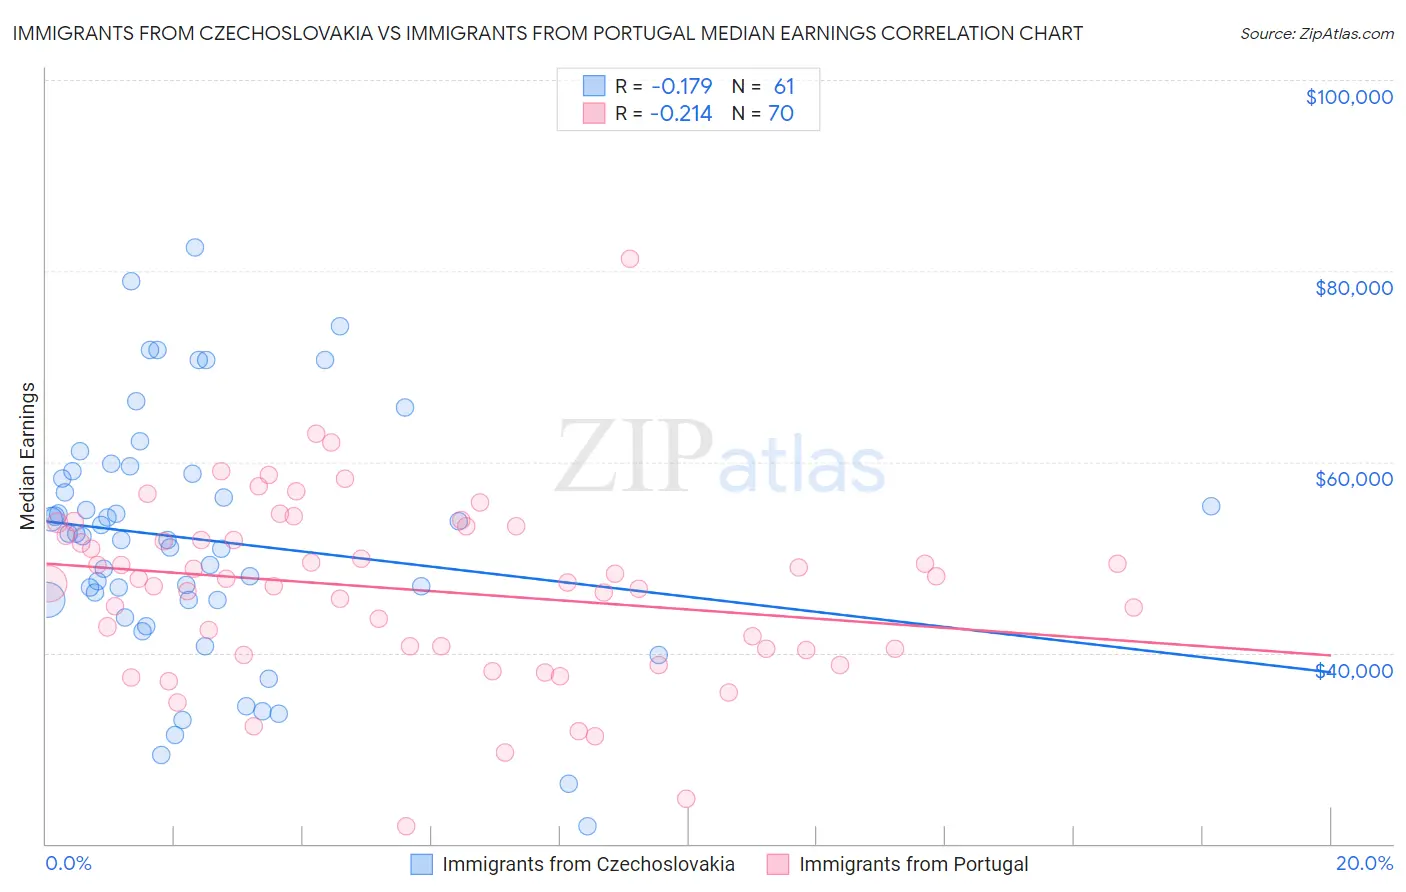
Immigrants from Czechoslovakia vs Immigrants from Portugal Median Earnings Correlation Chart
The statistical analysis conducted on geographies consisting of 195,449,585 people shows a poor negative correlation between the proportion of Immigrants from Czechoslovakia and median earnings in the United States with a correlation coefficient (R) of -0.179 and weighted average of $52,361. Similarly, the statistical analysis conducted on geographies consisting of 174,787,782 people shows a weak negative correlation between the proportion of Immigrants from Portugal and median earnings in the United States with a correlation coefficient (R) of -0.214 and weighted average of $47,304, a difference of 10.7%.
Median Earnings Correlation Summary
| Measurement | Immigrants from Czechoslovakia | Immigrants from Portugal |
| Minimum | $21,875 | $21,818 |
| Maximum | $82,450 | $81,250 |
| Range | $60,575 | $59,432 |
| Mean | $51,817 | $46,644 |
| Median | $52,166 | $47,553 |
| Interquartile 25% (IQ1) | $45,495 | $40,436 |
| Interquartile 75% (IQ3) | $58,910 | $52,307 |
| Interquartile Range (IQR) | $13,415 | $11,871 |
| Standard Deviation (Sample) | $12,779 | $9,540 |
| Standard Deviation (Population) | $12,674 | $9,471 |
Similar Demographics by Median Earnings
Demographics Similar to Immigrants from Czechoslovakia by Median Earnings
In terms of median earnings, the demographic groups most similar to Immigrants from Czechoslovakia are Bhutanese ($52,297, a difference of 0.12%), Australian ($52,294, a difference of 0.13%), Immigrants from Malaysia ($52,514, a difference of 0.29%), Bulgarian ($52,512, a difference of 0.29%), and Maltese ($52,526, a difference of 0.31%).
| Demographics | Rating | Rank | Median Earnings |
| Latvians | 100.0 /100 | #38 | Exceptional $53,001 |
| Immigrants | Turkey | 100.0 /100 | #39 | Exceptional $52,960 |
| Israelis | 100.0 /100 | #40 | Exceptional $52,937 |
| Immigrants | Lithuania | 100.0 /100 | #41 | Exceptional $52,769 |
| Maltese | 100.0 /100 | #42 | Exceptional $52,526 |
| Immigrants | Malaysia | 100.0 /100 | #43 | Exceptional $52,514 |
| Bulgarians | 100.0 /100 | #44 | Exceptional $52,512 |
| Immigrants | Czechoslovakia | 100.0 /100 | #45 | Exceptional $52,361 |
| Bhutanese | 100.0 /100 | #46 | Exceptional $52,297 |
| Australians | 100.0 /100 | #47 | Exceptional $52,294 |
| Immigrants | Europe | 100.0 /100 | #48 | Exceptional $52,195 |
| Bolivians | 100.0 /100 | #49 | Exceptional $52,005 |
| Immigrants | South Africa | 100.0 /100 | #50 | Exceptional $51,850 |
| Immigrants | Austria | 99.9 /100 | #51 | Exceptional $51,826 |
| Estonians | 99.9 /100 | #52 | Exceptional $51,772 |
Demographics Similar to Immigrants from Portugal by Median Earnings
In terms of median earnings, the demographic groups most similar to Immigrants from Portugal are Immigrants from Vietnam ($47,282, a difference of 0.050%), Irish ($47,276, a difference of 0.060%), Czech ($47,221, a difference of 0.18%), Slavic ($47,470, a difference of 0.35%), and Slovak ($47,095, a difference of 0.44%).
| Demographics | Rating | Rank | Median Earnings |
| Immigrants | South Eastern Asia | 85.0 /100 | #147 | Excellent $47,671 |
| Immigrants | Eritrea | 84.8 /100 | #148 | Excellent $47,657 |
| Luxembourgers | 84.5 /100 | #149 | Excellent $47,640 |
| Peruvians | 84.2 /100 | #150 | Excellent $47,628 |
| Immigrants | Oceania | 84.1 /100 | #151 | Excellent $47,617 |
| Immigrants | Germany | 83.1 /100 | #152 | Excellent $47,566 |
| Slavs | 81.1 /100 | #153 | Excellent $47,470 |
| Immigrants | Portugal | 77.3 /100 | #154 | Good $47,304 |
| Immigrants | Vietnam | 76.7 /100 | #155 | Good $47,282 |
| Irish | 76.6 /100 | #156 | Good $47,276 |
| Czechs | 75.1 /100 | #157 | Good $47,221 |
| Slovaks | 71.7 /100 | #158 | Good $47,095 |
| Immigrants | Peru | 69.6 /100 | #159 | Good $47,025 |
| Alsatians | 69.6 /100 | #160 | Good $47,023 |
| Immigrants | Eastern Africa | 68.0 /100 | #161 | Good $46,969 |