Creek vs Scotch-Irish Median Earnings
COMPARE
Creek
Scotch-Irish
Median Earnings
Median Earnings Comparison
Creek
Scotch-Irish
$39,648
MEDIAN EARNINGS
0.0/ 100
METRIC RATING
325th/ 347
METRIC RANK
$44,924
MEDIAN EARNINGS
10.7/ 100
METRIC RATING
229th/ 347
METRIC RANK
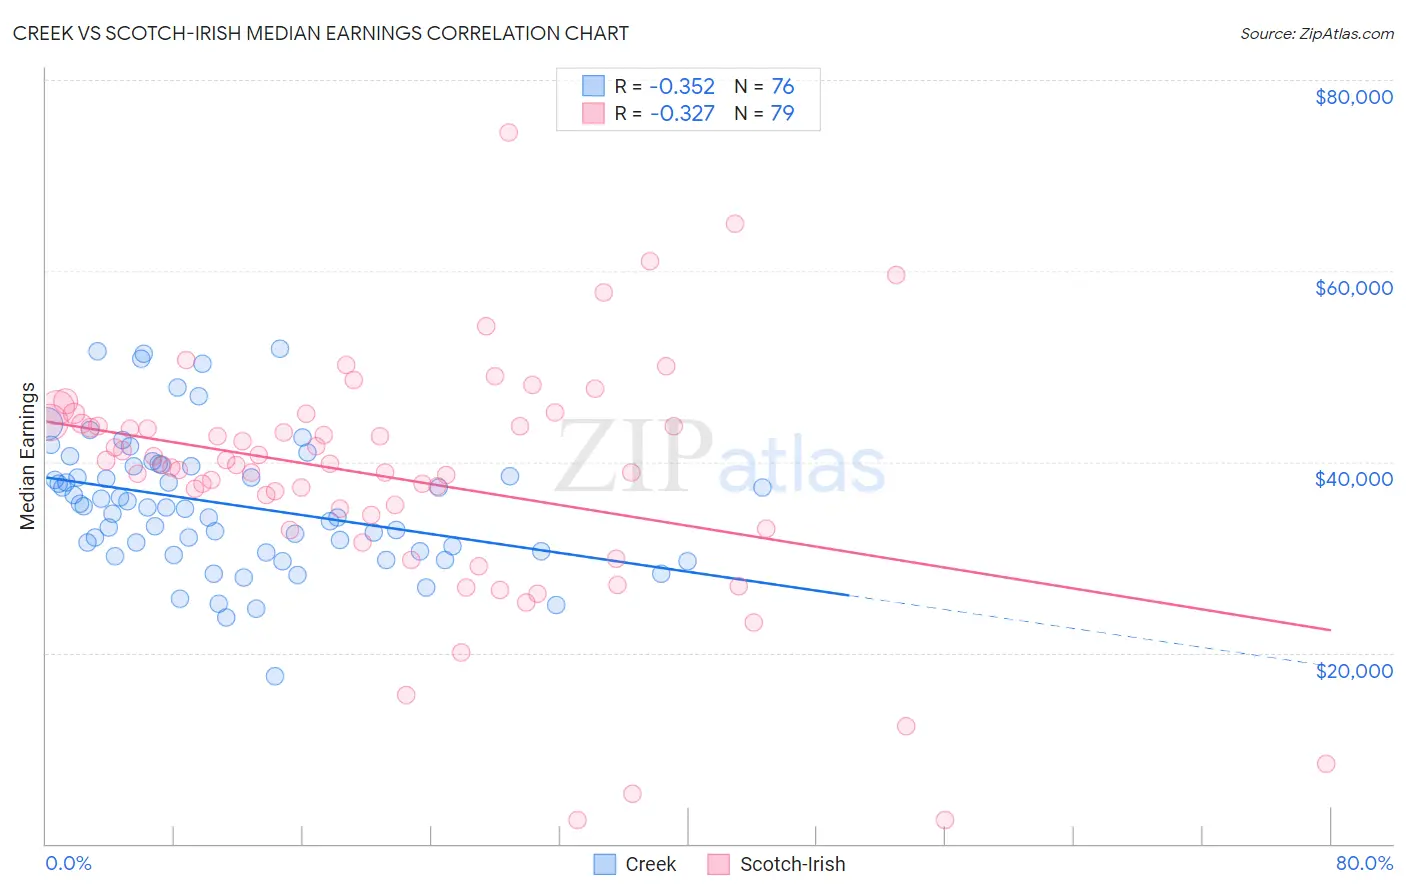
Creek vs Scotch-Irish Median Earnings Correlation Chart
The statistical analysis conducted on geographies consisting of 178,470,234 people shows a mild negative correlation between the proportion of Creek and median earnings in the United States with a correlation coefficient (R) of -0.352 and weighted average of $39,648. Similarly, the statistical analysis conducted on geographies consisting of 548,498,961 people shows a mild negative correlation between the proportion of Scotch-Irish and median earnings in the United States with a correlation coefficient (R) of -0.327 and weighted average of $44,924, a difference of 13.3%.
Median Earnings Correlation Summary
| Measurement | Creek | Scotch-Irish |
| Minimum | $17,500 | $2,499 |
| Maximum | $51,875 | $74,508 |
| Range | $34,375 | $72,009 |
| Mean | $35,536 | $38,268 |
| Median | $35,262 | $39,708 |
| Interquartile 25% (IQ1) | $30,664 | $32,986 |
| Interquartile 75% (IQ3) | $39,531 | $43,991 |
| Interquartile Range (IQR) | $8,868 | $11,005 |
| Standard Deviation (Sample) | $6,944 | $12,720 |
| Standard Deviation (Population) | $6,899 | $12,639 |
Similar Demographics by Median Earnings
Demographics Similar to Creek by Median Earnings
In terms of median earnings, the demographic groups most similar to Creek are Ottawa ($39,721, a difference of 0.18%), Bahamian ($39,735, a difference of 0.22%), Immigrants from Yemen ($39,540, a difference of 0.27%), Immigrants from Central America ($39,762, a difference of 0.29%), and Yuman ($39,523, a difference of 0.32%).
| Demographics | Rating | Rank | Median Earnings |
| Dutch West Indians | 0.0 /100 | #318 | Tragic $40,107 |
| Blacks/African Americans | 0.0 /100 | #319 | Tragic $40,085 |
| Immigrants | Bahamas | 0.0 /100 | #320 | Tragic $39,861 |
| Mexicans | 0.0 /100 | #321 | Tragic $39,834 |
| Immigrants | Central America | 0.0 /100 | #322 | Tragic $39,762 |
| Bahamians | 0.0 /100 | #323 | Tragic $39,735 |
| Ottawa | 0.0 /100 | #324 | Tragic $39,721 |
| Creek | 0.0 /100 | #325 | Tragic $39,648 |
| Immigrants | Yemen | 0.0 /100 | #326 | Tragic $39,540 |
| Yuman | 0.0 /100 | #327 | Tragic $39,523 |
| Sioux | 0.0 /100 | #328 | Tragic $39,448 |
| Kiowa | 0.0 /100 | #329 | Tragic $39,232 |
| Immigrants | Congo | 0.0 /100 | #330 | Tragic $39,169 |
| Immigrants | Mexico | 0.0 /100 | #331 | Tragic $39,114 |
| Yakama | 0.0 /100 | #332 | Tragic $39,107 |
Demographics Similar to Scotch-Irish by Median Earnings
In terms of median earnings, the demographic groups most similar to Scotch-Irish are Immigrants from Western Africa ($44,893, a difference of 0.070%), Immigrants from Iraq ($44,988, a difference of 0.14%), Japanese ($44,825, a difference of 0.22%), Native Hawaiian ($45,027, a difference of 0.23%), and Immigrants from Nigeria ($45,030, a difference of 0.24%).
| Demographics | Rating | Rank | Median Earnings |
| Immigrants | Panama | 15.0 /100 | #222 | Poor $45,198 |
| Whites/Caucasians | 15.0 /100 | #223 | Poor $45,197 |
| West Indians | 13.9 /100 | #224 | Poor $45,132 |
| Immigrants | Cambodia | 13.2 /100 | #225 | Poor $45,090 |
| Immigrants | Nigeria | 12.2 /100 | #226 | Poor $45,030 |
| Native Hawaiians | 12.2 /100 | #227 | Poor $45,027 |
| Immigrants | Iraq | 11.6 /100 | #228 | Poor $44,988 |
| Scotch-Irish | 10.7 /100 | #229 | Poor $44,924 |
| Immigrants | Western Africa | 10.3 /100 | #230 | Poor $44,893 |
| Japanese | 9.5 /100 | #231 | Tragic $44,825 |
| Delaware | 9.0 /100 | #232 | Tragic $44,783 |
| Immigrants | Sudan | 8.8 /100 | #233 | Tragic $44,767 |
| Cape Verdeans | 7.5 /100 | #234 | Tragic $44,640 |
| Venezuelans | 6.9 /100 | #235 | Tragic $44,580 |
| British West Indians | 6.7 /100 | #236 | Tragic $44,552 |