Creek vs Immigrants from Croatia Median Earnings
COMPARE
Creek
Immigrants from Croatia
Median Earnings
Median Earnings Comparison
Creek
Immigrants from Croatia
$39,648
MEDIAN EARNINGS
0.0/ 100
METRIC RATING
325th/ 347
METRIC RANK
$51,581
MEDIAN EARNINGS
99.9/ 100
METRIC RATING
59th/ 347
METRIC RANK
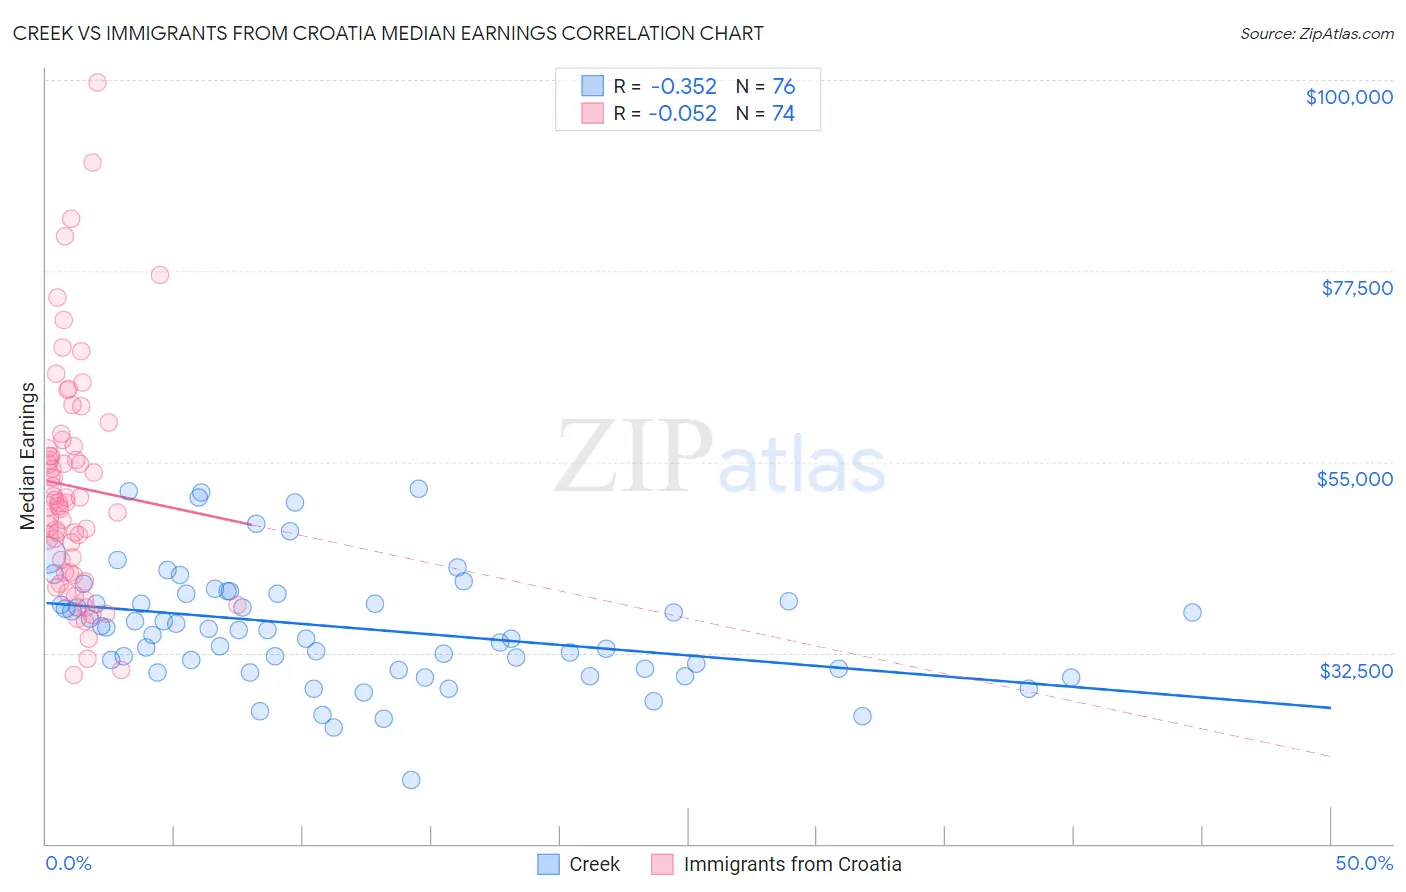
Creek vs Immigrants from Croatia Median Earnings Correlation Chart
The statistical analysis conducted on geographies consisting of 178,470,234 people shows a mild negative correlation between the proportion of Creek and median earnings in the United States with a correlation coefficient (R) of -0.352 and weighted average of $39,648. Similarly, the statistical analysis conducted on geographies consisting of 132,573,888 people shows a slight negative correlation between the proportion of Immigrants from Croatia and median earnings in the United States with a correlation coefficient (R) of -0.052 and weighted average of $51,581, a difference of 30.1%.
Median Earnings Correlation Summary
| Measurement | Creek | Immigrants from Croatia |
| Minimum | $17,500 | $29,868 |
| Maximum | $51,875 | $99,706 |
| Range | $34,375 | $69,838 |
| Mean | $35,536 | $52,095 |
| Median | $35,262 | $50,253 |
| Interquartile 25% (IQ1) | $30,664 | $41,915 |
| Interquartile 75% (IQ3) | $39,531 | $56,902 |
| Interquartile Range (IQR) | $8,868 | $14,987 |
| Standard Deviation (Sample) | $6,944 | $13,541 |
| Standard Deviation (Population) | $6,899 | $13,449 |
Similar Demographics by Median Earnings
Demographics Similar to Creek by Median Earnings
In terms of median earnings, the demographic groups most similar to Creek are Ottawa ($39,721, a difference of 0.18%), Bahamian ($39,735, a difference of 0.22%), Immigrants from Yemen ($39,540, a difference of 0.27%), Immigrants from Central America ($39,762, a difference of 0.29%), and Yuman ($39,523, a difference of 0.32%).
| Demographics | Rating | Rank | Median Earnings |
| Dutch West Indians | 0.0 /100 | #318 | Tragic $40,107 |
| Blacks/African Americans | 0.0 /100 | #319 | Tragic $40,085 |
| Immigrants | Bahamas | 0.0 /100 | #320 | Tragic $39,861 |
| Mexicans | 0.0 /100 | #321 | Tragic $39,834 |
| Immigrants | Central America | 0.0 /100 | #322 | Tragic $39,762 |
| Bahamians | 0.0 /100 | #323 | Tragic $39,735 |
| Ottawa | 0.0 /100 | #324 | Tragic $39,721 |
| Creek | 0.0 /100 | #325 | Tragic $39,648 |
| Immigrants | Yemen | 0.0 /100 | #326 | Tragic $39,540 |
| Yuman | 0.0 /100 | #327 | Tragic $39,523 |
| Sioux | 0.0 /100 | #328 | Tragic $39,448 |
| Kiowa | 0.0 /100 | #329 | Tragic $39,232 |
| Immigrants | Congo | 0.0 /100 | #330 | Tragic $39,169 |
| Immigrants | Mexico | 0.0 /100 | #331 | Tragic $39,114 |
| Yakama | 0.0 /100 | #332 | Tragic $39,107 |
Demographics Similar to Immigrants from Croatia by Median Earnings
In terms of median earnings, the demographic groups most similar to Immigrants from Croatia are Immigrants from Bolivia ($51,605, a difference of 0.050%), Immigrants from Serbia ($51,557, a difference of 0.050%), Immigrants from Latvia ($51,555, a difference of 0.050%), Immigrants from Eastern Europe ($51,624, a difference of 0.080%), and Immigrants from Pakistan ($51,693, a difference of 0.22%).
| Demographics | Rating | Rank | Median Earnings |
| Estonians | 99.9 /100 | #52 | Exceptional $51,772 |
| Immigrants | Norway | 99.9 /100 | #53 | Exceptional $51,758 |
| Immigrants | Indonesia | 99.9 /100 | #54 | Exceptional $51,715 |
| Egyptians | 99.9 /100 | #55 | Exceptional $51,701 |
| Immigrants | Pakistan | 99.9 /100 | #56 | Exceptional $51,693 |
| Immigrants | Eastern Europe | 99.9 /100 | #57 | Exceptional $51,624 |
| Immigrants | Bolivia | 99.9 /100 | #58 | Exceptional $51,605 |
| Immigrants | Croatia | 99.9 /100 | #59 | Exceptional $51,581 |
| Immigrants | Serbia | 99.9 /100 | #60 | Exceptional $51,557 |
| Immigrants | Latvia | 99.9 /100 | #61 | Exceptional $51,555 |
| Immigrants | Romania | 99.9 /100 | #62 | Exceptional $51,337 |
| Immigrants | Bulgaria | 99.9 /100 | #63 | Exceptional $51,318 |
| New Zealanders | 99.9 /100 | #64 | Exceptional $51,246 |
| Greeks | 99.9 /100 | #65 | Exceptional $51,164 |
| Afghans | 99.9 /100 | #66 | Exceptional $51,112 |