Cree vs Sri Lankan GED/Equivalency
COMPARE
Cree
Sri Lankan
GED/Equivalency
GED/Equivalency Comparison
Cree
Sri Lankans
85.0%
GED/EQUIVALENCY
15.9/ 100
METRIC RATING
202nd/ 347
METRIC RANK
84.0%
GED/EQUIVALENCY
1.9/ 100
METRIC RATING
242nd/ 347
METRIC RANK
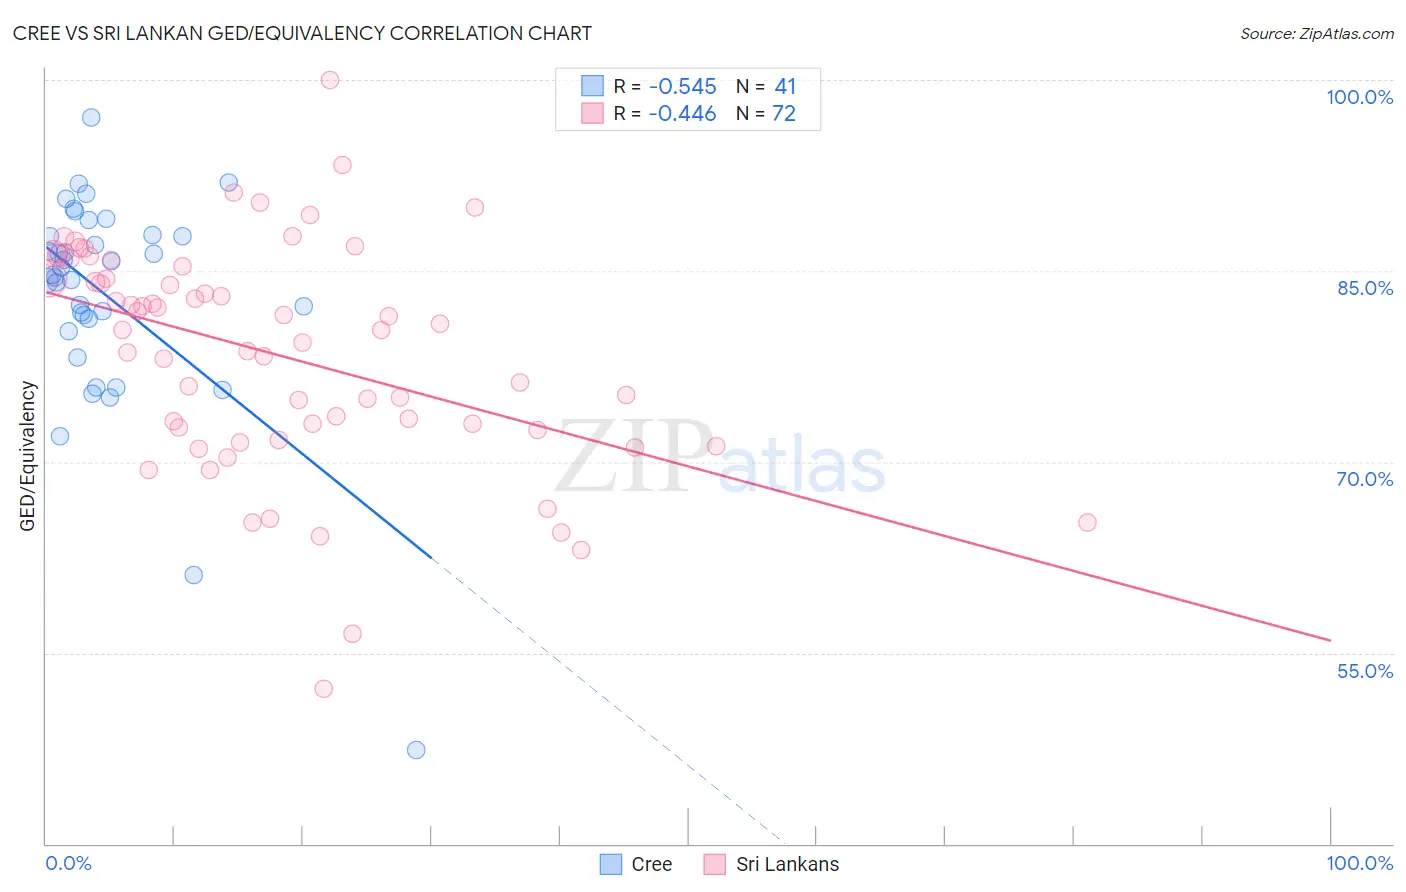
Cree vs Sri Lankan GED/Equivalency Correlation Chart
The statistical analysis conducted on geographies consisting of 76,211,744 people shows a substantial negative correlation between the proportion of Cree and percentage of population with at least ged/equivalency education in the United States with a correlation coefficient (R) of -0.545 and weighted average of 85.0%. Similarly, the statistical analysis conducted on geographies consisting of 440,593,488 people shows a moderate negative correlation between the proportion of Sri Lankans and percentage of population with at least ged/equivalency education in the United States with a correlation coefficient (R) of -0.446 and weighted average of 84.0%, a difference of 1.2%.
GED/Equivalency Correlation Summary
| Measurement | Cree | Sri Lankan |
| Minimum | 47.4% | 52.1% |
| Maximum | 97.0% | 100.0% |
| Range | 49.7% | 47.9% |
| Mean | 83.0% | 78.4% |
| Median | 84.7% | 80.3% |
| Interquartile 25% (IQ1) | 80.8% | 72.6% |
| Interquartile 75% (IQ3) | 87.8% | 84.9% |
| Interquartile Range (IQR) | 7.0% | 12.3% |
| Standard Deviation (Sample) | 8.7% | 8.9% |
| Standard Deviation (Population) | 8.5% | 8.8% |
Similar Demographics by GED/Equivalency
Demographics Similar to Cree by GED/Equivalency
In terms of ged/equivalency, the demographic groups most similar to Cree are Portuguese (85.0%, a difference of 0.0%), Uruguayan (85.0%, a difference of 0.010%), Somali (85.0%, a difference of 0.020%), Panamanian (85.0%, a difference of 0.020%), and Hawaiian (85.0%, a difference of 0.030%).
| Demographics | Rating | Rank | GED/Equivalency |
| Chippewa | 20.8 /100 | #195 | Fair 85.2% |
| Tongans | 20.7 /100 | #196 | Fair 85.2% |
| Costa Ricans | 20.4 /100 | #197 | Fair 85.2% |
| Immigrants | Africa | 17.5 /100 | #198 | Poor 85.1% |
| Somalis | 16.4 /100 | #199 | Poor 85.0% |
| Uruguayans | 16.0 /100 | #200 | Poor 85.0% |
| Portuguese | 15.9 /100 | #201 | Poor 85.0% |
| Cree | 15.9 /100 | #202 | Poor 85.0% |
| Panamanians | 15.3 /100 | #203 | Poor 85.0% |
| Hawaiians | 15.2 /100 | #204 | Poor 85.0% |
| Liberians | 14.6 /100 | #205 | Poor 85.0% |
| Samoans | 13.7 /100 | #206 | Poor 84.9% |
| Hmong | 13.1 /100 | #207 | Poor 84.9% |
| Marshallese | 12.5 /100 | #208 | Poor 84.9% |
| Colombians | 12.3 /100 | #209 | Poor 84.9% |
Demographics Similar to Sri Lankans by GED/Equivalency
In terms of ged/equivalency, the demographic groups most similar to Sri Lankans are Senegalese (84.0%, a difference of 0.020%), Immigrants from South Eastern Asia (84.1%, a difference of 0.16%), Cherokee (83.9%, a difference of 0.17%), Immigrants from Bahamas (84.2%, a difference of 0.18%), and Immigrants from Ghana (83.9%, a difference of 0.18%).
| Demographics | Rating | Rank | GED/Equivalency |
| Ghanaians | 3.5 /100 | #235 | Tragic 84.3% |
| Immigrants | Eritrea | 3.5 /100 | #236 | Tragic 84.3% |
| Sub-Saharan Africans | 3.0 /100 | #237 | Tragic 84.2% |
| Immigrants | Peru | 2.7 /100 | #238 | Tragic 84.2% |
| Immigrants | Bahamas | 2.6 /100 | #239 | Tragic 84.2% |
| Immigrants | South Eastern Asia | 2.5 /100 | #240 | Tragic 84.1% |
| Senegalese | 1.9 /100 | #241 | Tragic 84.0% |
| Sri Lankans | 1.9 /100 | #242 | Tragic 84.0% |
| Cherokee | 1.3 /100 | #243 | Tragic 83.9% |
| Immigrants | Ghana | 1.3 /100 | #244 | Tragic 83.9% |
| Immigrants | Senegal | 1.2 /100 | #245 | Tragic 83.8% |
| Chickasaw | 1.2 /100 | #246 | Tragic 83.8% |
| Immigrants | Western Africa | 1.1 /100 | #247 | Tragic 83.8% |
| Blackfeet | 1.1 /100 | #248 | Tragic 83.8% |
| Crow | 1.1 /100 | #249 | Tragic 83.8% |