Choctaw vs Colombian Householder Income Ages 45 - 64 years
COMPARE
Choctaw
Colombian
Householder Income Ages 45 - 64 years
Householder Income Ages 45 - 64 years Comparison
Choctaw
Colombians
$82,287
HOUSEHOLDER INCOME AGES 45 - 64 YEARS
0.0/ 100
METRIC RATING
318th/ 347
METRIC RANK
$99,772
HOUSEHOLDER INCOME AGES 45 - 64 YEARS
43.2/ 100
METRIC RATING
185th/ 347
METRIC RANK
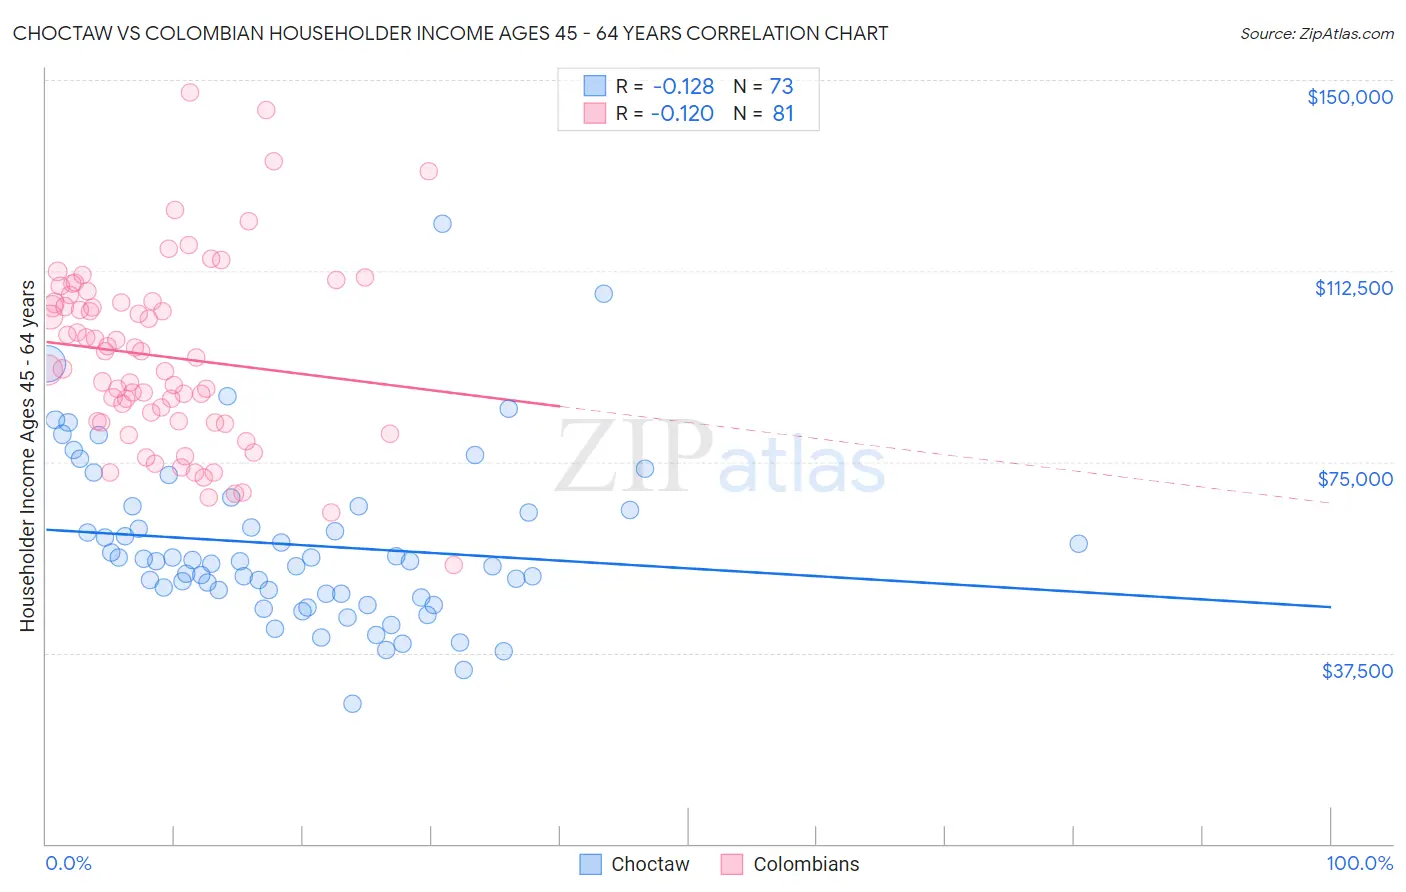
Choctaw vs Colombian Householder Income Ages 45 - 64 years Correlation Chart
The statistical analysis conducted on geographies consisting of 269,212,167 people shows a poor negative correlation between the proportion of Choctaw and household income with householder between the ages 45 and 64 in the United States with a correlation coefficient (R) of -0.128 and weighted average of $82,287. Similarly, the statistical analysis conducted on geographies consisting of 418,806,798 people shows a poor negative correlation between the proportion of Colombians and household income with householder between the ages 45 and 64 in the United States with a correlation coefficient (R) of -0.120 and weighted average of $99,772, a difference of 21.2%.
Householder Income Ages 45 - 64 years Correlation Summary
| Measurement | Choctaw | Colombian |
| Minimum | $27,500 | $54,659 |
| Maximum | $121,667 | $147,591 |
| Range | $94,167 | $92,932 |
| Mean | $58,687 | $95,720 |
| Median | $55,469 | $95,478 |
| Interquartile 25% (IQ1) | $48,732 | $82,814 |
| Interquartile 75% (IQ3) | $65,840 | $106,476 |
| Interquartile Range (IQR) | $17,109 | $23,662 |
| Standard Deviation (Sample) | $16,580 | $17,882 |
| Standard Deviation (Population) | $16,466 | $17,771 |
Similar Demographics by Householder Income Ages 45 - 64 years
Demographics Similar to Choctaw by Householder Income Ages 45 - 64 years
In terms of householder income ages 45 - 64 years, the demographic groups most similar to Choctaw are Chickasaw ($82,193, a difference of 0.11%), Apache ($82,184, a difference of 0.13%), Yuman ($82,139, a difference of 0.18%), Colville ($82,474, a difference of 0.23%), and Immigrants from Caribbean ($82,513, a difference of 0.28%).
| Demographics | Rating | Rank | Householder Income Ages 45 - 64 years |
| Immigrants | Bahamas | 0.0 /100 | #311 | Tragic $83,177 |
| Cajuns | 0.0 /100 | #312 | Tragic $83,015 |
| U.S. Virgin Islanders | 0.0 /100 | #313 | Tragic $82,736 |
| Immigrants | Honduras | 0.0 /100 | #314 | Tragic $82,697 |
| Paiute | 0.0 /100 | #315 | Tragic $82,629 |
| Immigrants | Caribbean | 0.0 /100 | #316 | Tragic $82,513 |
| Colville | 0.0 /100 | #317 | Tragic $82,474 |
| Choctaw | 0.0 /100 | #318 | Tragic $82,287 |
| Chickasaw | 0.0 /100 | #319 | Tragic $82,193 |
| Apache | 0.0 /100 | #320 | Tragic $82,184 |
| Yuman | 0.0 /100 | #321 | Tragic $82,139 |
| Sioux | 0.0 /100 | #322 | Tragic $81,750 |
| Bahamians | 0.0 /100 | #323 | Tragic $81,369 |
| Yup'ik | 0.0 /100 | #324 | Tragic $81,000 |
| Immigrants | Cuba | 0.0 /100 | #325 | Tragic $80,662 |
Demographics Similar to Colombians by Householder Income Ages 45 - 64 years
In terms of householder income ages 45 - 64 years, the demographic groups most similar to Colombians are French ($99,824, a difference of 0.050%), Spaniard ($99,889, a difference of 0.12%), Dutch ($99,650, a difference of 0.12%), Finnish ($99,904, a difference of 0.13%), and Immigrants ($99,943, a difference of 0.17%).
| Demographics | Rating | Rank | Householder Income Ages 45 - 64 years |
| Immigrants | Cameroon | 47.0 /100 | #178 | Average $100,084 |
| Belgians | 46.7 /100 | #179 | Average $100,060 |
| Aleuts | 46.6 /100 | #180 | Average $100,052 |
| Immigrants | Immigrants | 45.3 /100 | #181 | Average $99,943 |
| Finns | 44.8 /100 | #182 | Average $99,904 |
| Spaniards | 44.6 /100 | #183 | Average $99,889 |
| French | 43.8 /100 | #184 | Average $99,824 |
| Colombians | 43.2 /100 | #185 | Average $99,772 |
| Dutch | 41.7 /100 | #186 | Average $99,650 |
| Iraqis | 38.5 /100 | #187 | Fair $99,387 |
| Immigrants | Portugal | 36.3 /100 | #188 | Fair $99,203 |
| Immigrants | South America | 35.4 /100 | #189 | Fair $99,126 |
| French Canadians | 35.1 /100 | #190 | Fair $99,093 |
| Kenyans | 33.7 /100 | #191 | Fair $98,970 |
| Celtics | 32.9 /100 | #192 | Fair $98,896 |