French vs Iroquois Median Female Earnings
COMPARE
French
Iroquois
Median Female Earnings
Median Female Earnings Comparison
French
Iroquois
$38,457
MEDIAN FEMALE EARNINGS
7.0/ 100
METRIC RATING
225th/ 347
METRIC RANK
$36,408
MEDIAN FEMALE EARNINGS
0.1/ 100
METRIC RATING
280th/ 347
METRIC RANK
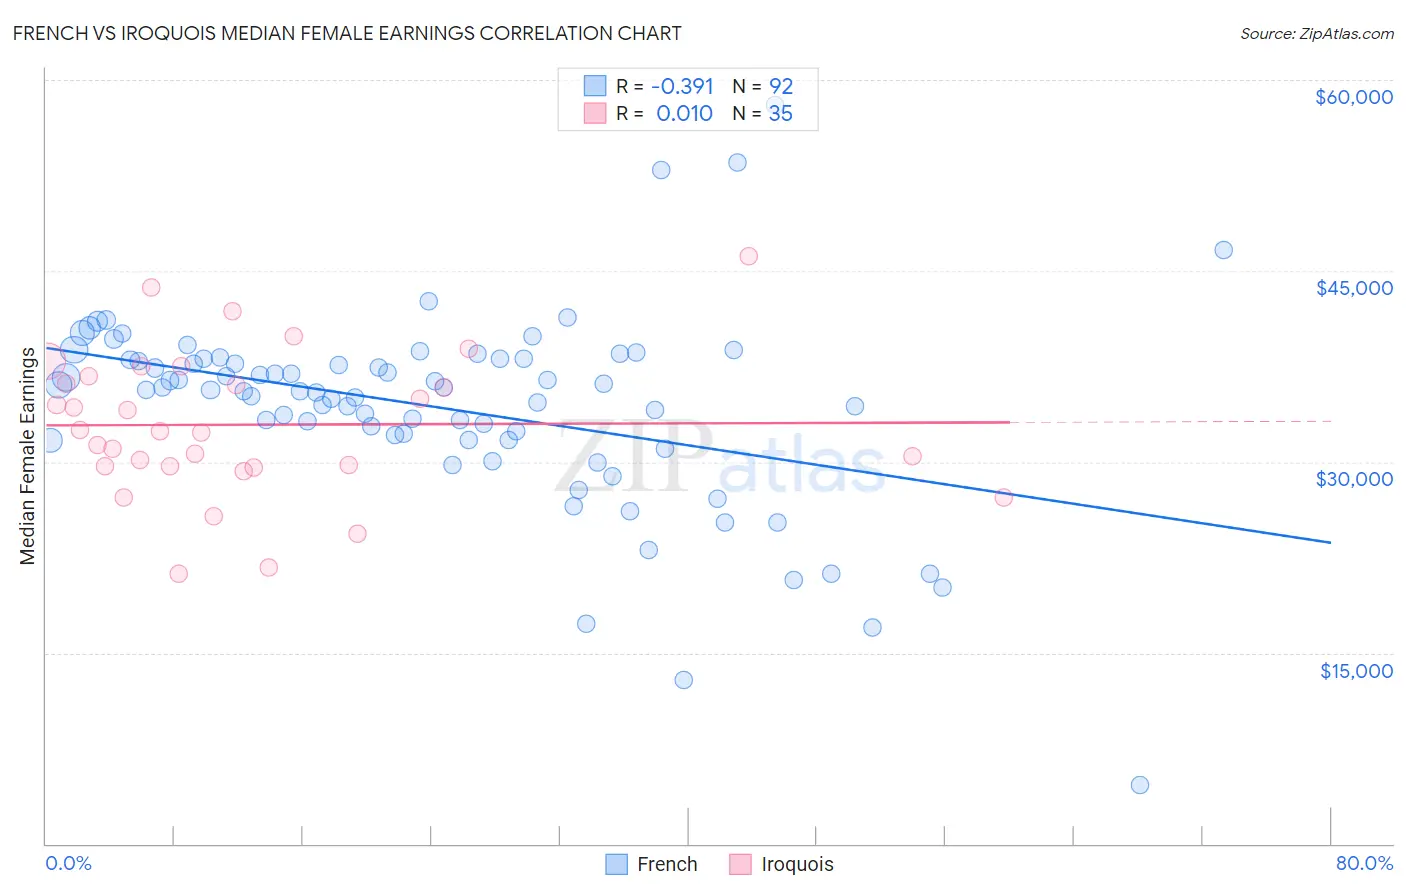
French vs Iroquois Median Female Earnings Correlation Chart
The statistical analysis conducted on geographies consisting of 570,640,239 people shows a mild negative correlation between the proportion of French and median female earnings in the United States with a correlation coefficient (R) of -0.391 and weighted average of $38,457. Similarly, the statistical analysis conducted on geographies consisting of 207,213,781 people shows no correlation between the proportion of Iroquois and median female earnings in the United States with a correlation coefficient (R) of 0.010 and weighted average of $36,408, a difference of 5.6%.
Median Female Earnings Correlation Summary
| Measurement | French | Iroquois |
| Minimum | $4,625 | $21,202 |
| Maximum | $58,008 | $46,154 |
| Range | $53,383 | $24,952 |
| Mean | $34,289 | $32,927 |
| Median | $35,683 | $32,405 |
| Interquartile 25% (IQ1) | $31,891 | $29,643 |
| Interquartile 75% (IQ3) | $38,063 | $36,768 |
| Interquartile Range (IQR) | $6,171 | $7,125 |
| Standard Deviation (Sample) | $7,750 | $5,712 |
| Standard Deviation (Population) | $7,708 | $5,630 |
Similar Demographics by Median Female Earnings
Demographics Similar to French by Median Female Earnings
In terms of median female earnings, the demographic groups most similar to French are Native Hawaiian ($38,461, a difference of 0.010%), French Canadian ($38,436, a difference of 0.050%), Immigrants from Sudan ($38,511, a difference of 0.14%), Scottish ($38,397, a difference of 0.15%), and Subsaharan African ($38,391, a difference of 0.17%).
| Demographics | Rating | Rank | Median Female Earnings |
| Cape Verdeans | 9.5 /100 | #218 | Tragic $38,614 |
| Nepalese | 9.3 /100 | #219 | Tragic $38,603 |
| Yugoslavians | 8.8 /100 | #220 | Tragic $38,573 |
| Immigrants | Azores | 8.8 /100 | #221 | Tragic $38,573 |
| Japanese | 8.1 /100 | #222 | Tragic $38,528 |
| Immigrants | Sudan | 7.8 /100 | #223 | Tragic $38,511 |
| Native Hawaiians | 7.1 /100 | #224 | Tragic $38,461 |
| French | 7.0 /100 | #225 | Tragic $38,457 |
| French Canadians | 6.8 /100 | #226 | Tragic $38,436 |
| Scottish | 6.3 /100 | #227 | Tragic $38,397 |
| Sub-Saharan Africans | 6.2 /100 | #228 | Tragic $38,391 |
| Belgians | 6.1 /100 | #229 | Tragic $38,382 |
| Basques | 5.7 /100 | #230 | Tragic $38,352 |
| Somalis | 5.5 /100 | #231 | Tragic $38,333 |
| Scandinavians | 5.2 /100 | #232 | Tragic $38,306 |
Demographics Similar to Iroquois by Median Female Earnings
In terms of median female earnings, the demographic groups most similar to Iroquois are Immigrants from Caribbean ($36,414, a difference of 0.020%), U.S. Virgin Islander ($36,424, a difference of 0.050%), Spanish American ($36,391, a difference of 0.050%), Haitian ($36,374, a difference of 0.090%), and Marshallese ($36,459, a difference of 0.14%).
| Demographics | Rating | Rank | Median Female Earnings |
| Immigrants | Laos | 0.3 /100 | #273 | Tragic $36,841 |
| Immigrants | El Salvador | 0.2 /100 | #274 | Tragic $36,673 |
| Africans | 0.1 /100 | #275 | Tragic $36,530 |
| Central Americans | 0.1 /100 | #276 | Tragic $36,492 |
| Marshallese | 0.1 /100 | #277 | Tragic $36,459 |
| U.S. Virgin Islanders | 0.1 /100 | #278 | Tragic $36,424 |
| Immigrants | Caribbean | 0.1 /100 | #279 | Tragic $36,414 |
| Iroquois | 0.1 /100 | #280 | Tragic $36,408 |
| Spanish Americans | 0.1 /100 | #281 | Tragic $36,391 |
| Haitians | 0.1 /100 | #282 | Tragic $36,374 |
| Immigrants | Haiti | 0.1 /100 | #283 | Tragic $36,203 |
| Indonesians | 0.1 /100 | #284 | Tragic $36,140 |
| Paiute | 0.1 /100 | #285 | Tragic $36,056 |
| Osage | 0.0 /100 | #286 | Tragic $36,034 |
| Immigrants | Nicaragua | 0.0 /100 | #287 | Tragic $36,023 |