Immigrants from South Africa vs Iraqi Median Female Earnings
COMPARE
Immigrants from South Africa
Iraqi
Median Female Earnings
Median Female Earnings Comparison
Immigrants from South Africa
Iraqis
$42,508
MEDIAN FEMALE EARNINGS
99.7/ 100
METRIC RATING
74th/ 347
METRIC RANK
$38,666
MEDIAN FEMALE EARNINGS
10.5/ 100
METRIC RATING
214th/ 347
METRIC RANK
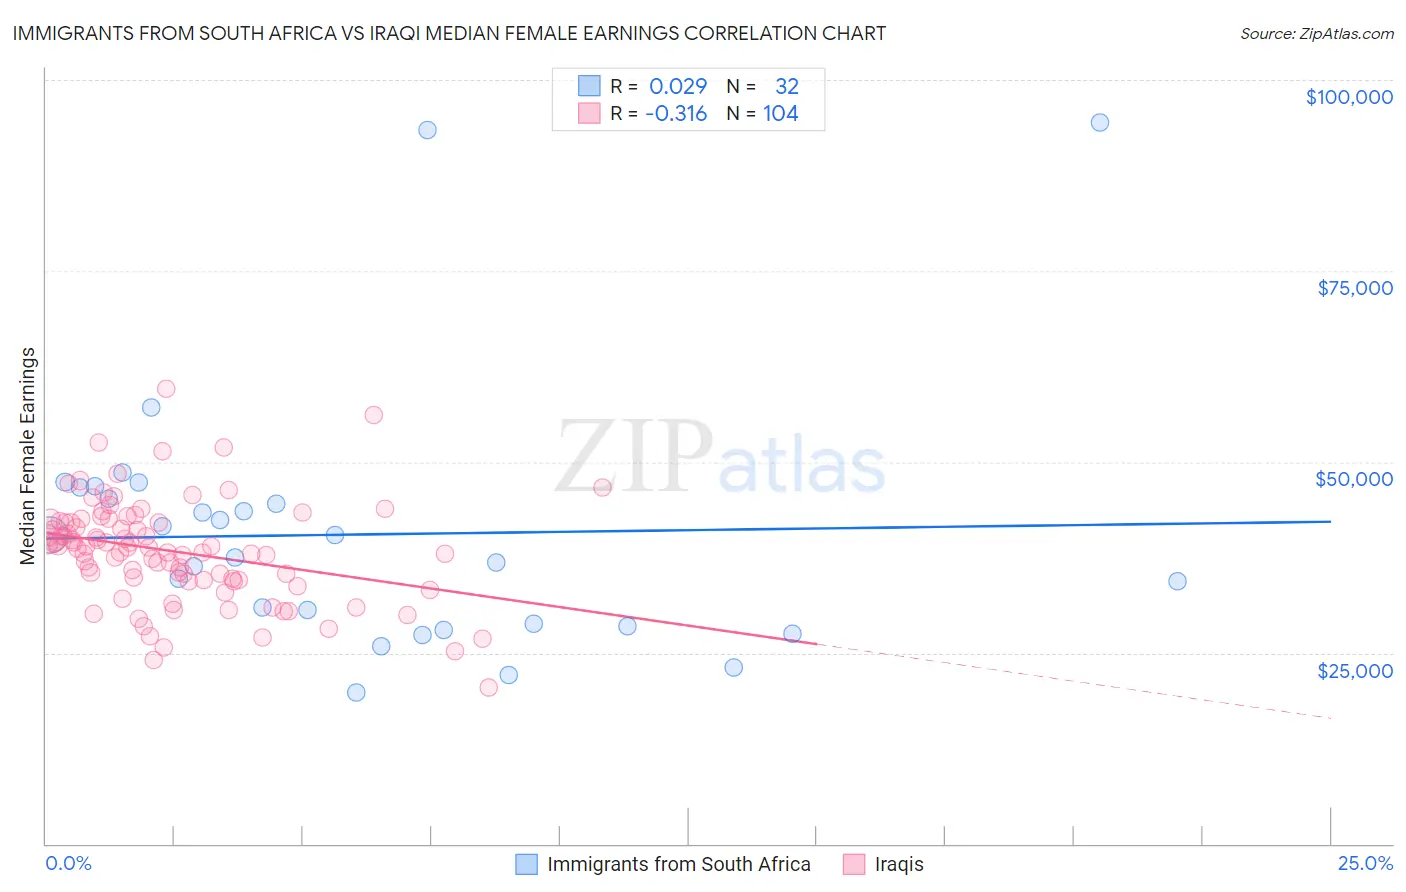
Immigrants from South Africa vs Iraqi Median Female Earnings Correlation Chart
The statistical analysis conducted on geographies consisting of 233,273,838 people shows no correlation between the proportion of Immigrants from South Africa and median female earnings in the United States with a correlation coefficient (R) of 0.029 and weighted average of $42,508. Similarly, the statistical analysis conducted on geographies consisting of 170,627,853 people shows a mild negative correlation between the proportion of Iraqis and median female earnings in the United States with a correlation coefficient (R) of -0.316 and weighted average of $38,666, a difference of 9.9%.
Median Female Earnings Correlation Summary
| Measurement | Immigrants from South Africa | Iraqi |
| Minimum | $19,821 | $20,406 |
| Maximum | $94,510 | $59,566 |
| Range | $74,689 | $39,160 |
| Mean | $40,489 | $38,287 |
| Median | $38,975 | $38,841 |
| Interquartile 25% (IQ1) | $28,607 | $34,526 |
| Interquartile 75% (IQ3) | $45,877 | $42,153 |
| Interquartile Range (IQR) | $17,270 | $7,626 |
| Standard Deviation (Sample) | $16,714 | $6,723 |
| Standard Deviation (Population) | $16,451 | $6,691 |
Similar Demographics by Median Female Earnings
Demographics Similar to Immigrants from South Africa by Median Female Earnings
In terms of median female earnings, the demographic groups most similar to Immigrants from South Africa are Mongolian ($42,542, a difference of 0.080%), New Zealander ($42,446, a difference of 0.15%), Immigrants from Italy ($42,446, a difference of 0.15%), Albanian ($42,584, a difference of 0.18%), and Immigrants from Albania ($42,388, a difference of 0.28%).
| Demographics | Rating | Rank | Median Female Earnings |
| Immigrants | Egypt | 99.9 /100 | #67 | Exceptional $42,837 |
| Immigrants | Austria | 99.8 /100 | #68 | Exceptional $42,824 |
| Immigrants | Spain | 99.8 /100 | #69 | Exceptional $42,815 |
| Immigrants | Ethiopia | 99.8 /100 | #70 | Exceptional $42,744 |
| Immigrants | Romania | 99.8 /100 | #71 | Exceptional $42,718 |
| Albanians | 99.8 /100 | #72 | Exceptional $42,584 |
| Mongolians | 99.7 /100 | #73 | Exceptional $42,542 |
| Immigrants | South Africa | 99.7 /100 | #74 | Exceptional $42,508 |
| New Zealanders | 99.7 /100 | #75 | Exceptional $42,446 |
| Immigrants | Italy | 99.7 /100 | #76 | Exceptional $42,446 |
| Immigrants | Albania | 99.6 /100 | #77 | Exceptional $42,388 |
| Immigrants | Kazakhstan | 99.6 /100 | #78 | Exceptional $42,386 |
| Greeks | 99.6 /100 | #79 | Exceptional $42,336 |
| Immigrants | Moldova | 99.6 /100 | #80 | Exceptional $42,304 |
| Immigrants | Southern Europe | 99.5 /100 | #81 | Exceptional $42,275 |
Demographics Similar to Iraqis by Median Female Earnings
In terms of median female earnings, the demographic groups most similar to Iraqis are Jamaican ($38,670, a difference of 0.010%), Spaniard ($38,656, a difference of 0.020%), Immigrants from Ecuador ($38,644, a difference of 0.060%), Immigrants from Jamaica ($38,625, a difference of 0.11%), and Guamanian/Chamorro ($38,717, a difference of 0.13%).
| Demographics | Rating | Rank | Median Female Earnings |
| Immigrants | Cambodia | 14.2 /100 | #207 | Poor $38,833 |
| Immigrants | Thailand | 13.6 /100 | #208 | Poor $38,810 |
| Norwegians | 13.4 /100 | #209 | Poor $38,802 |
| Czechoslovakians | 12.0 /100 | #210 | Poor $38,738 |
| Aleuts | 11.6 /100 | #211 | Poor $38,719 |
| Guamanians/Chamorros | 11.5 /100 | #212 | Poor $38,717 |
| Jamaicans | 10.5 /100 | #213 | Poor $38,670 |
| Iraqis | 10.5 /100 | #214 | Poor $38,666 |
| Spaniards | 10.3 /100 | #215 | Poor $38,656 |
| Immigrants | Ecuador | 10.1 /100 | #216 | Poor $38,644 |
| Immigrants | Jamaica | 9.7 /100 | #217 | Tragic $38,625 |
| Cape Verdeans | 9.5 /100 | #218 | Tragic $38,614 |
| Nepalese | 9.3 /100 | #219 | Tragic $38,603 |
| Yugoslavians | 8.8 /100 | #220 | Tragic $38,573 |
| Immigrants | Azores | 8.8 /100 | #221 | Tragic $38,573 |