Chippewa vs Iraqi Divorced or Separated
COMPARE
Chippewa
Iraqi
Divorced or Separated
Divorced or Separated Comparison
Chippewa
Iraqis
13.2%
DIVORCED OR SEPARATED
0.0/ 100
METRIC RATING
305th/ 347
METRIC RANK
11.8%
DIVORCED OR SEPARATED
94.6/ 100
METRIC RATING
120th/ 347
METRIC RANK
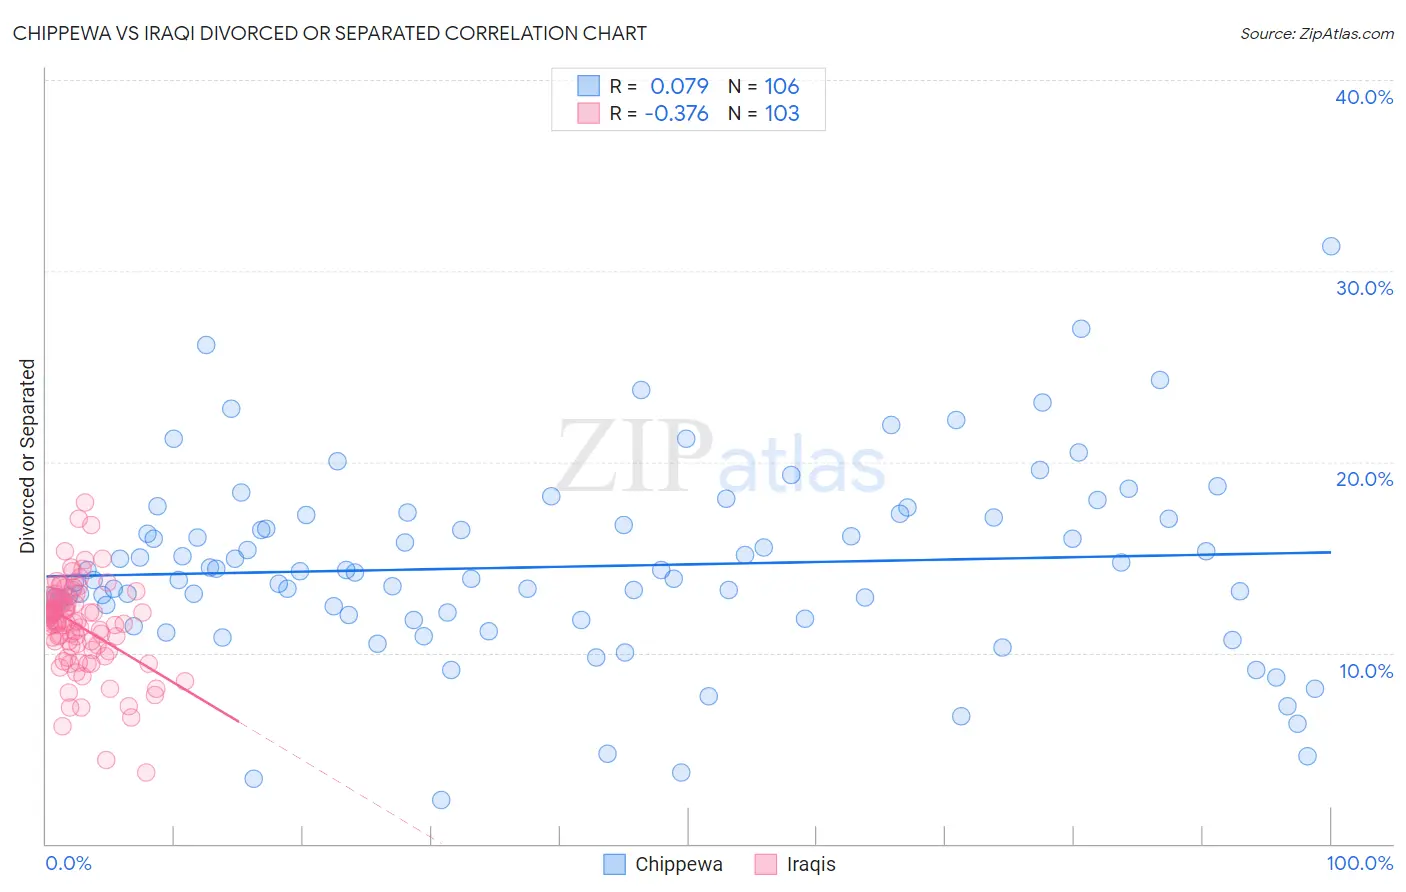
Chippewa vs Iraqi Divorced or Separated Correlation Chart
The statistical analysis conducted on geographies consisting of 215,036,643 people shows a slight positive correlation between the proportion of Chippewa and percentage of population currently divorced or separated in the United States with a correlation coefficient (R) of 0.079 and weighted average of 13.2%. Similarly, the statistical analysis conducted on geographies consisting of 170,608,468 people shows a mild negative correlation between the proportion of Iraqis and percentage of population currently divorced or separated in the United States with a correlation coefficient (R) of -0.376 and weighted average of 11.8%, a difference of 12.0%.
Divorced or Separated Correlation Summary
| Measurement | Chippewa | Iraqi |
| Minimum | 2.3% | 3.7% |
| Maximum | 31.3% | 17.9% |
| Range | 29.0% | 14.2% |
| Mean | 14.5% | 11.4% |
| Median | 14.2% | 11.7% |
| Interquartile 25% (IQ1) | 12.0% | 10.4% |
| Interquartile 75% (IQ3) | 17.1% | 12.7% |
| Interquartile Range (IQR) | 5.1% | 2.4% |
| Standard Deviation (Sample) | 4.9% | 2.4% |
| Standard Deviation (Population) | 4.9% | 2.4% |
Similar Demographics by Divorced or Separated
Demographics Similar to Chippewa by Divorced or Separated
In terms of divorced or separated, the demographic groups most similar to Chippewa are Hopi (13.2%, a difference of 0.050%), Tlingit-Haida (13.2%, a difference of 0.16%), Cape Verdean (13.1%, a difference of 0.18%), Immigrants from Venezuela (13.1%, a difference of 0.20%), and Alaskan Athabascan (13.1%, a difference of 0.30%).
| Demographics | Rating | Rank | Divorced or Separated |
| Venezuelans | 0.0 /100 | #298 | Tragic 13.0% |
| Immigrants | Jamaica | 0.0 /100 | #299 | Tragic 13.0% |
| Immigrants | Cabo Verde | 0.0 /100 | #300 | Tragic 13.1% |
| Alaskan Athabascans | 0.0 /100 | #301 | Tragic 13.1% |
| Immigrants | Venezuela | 0.0 /100 | #302 | Tragic 13.1% |
| Cape Verdeans | 0.0 /100 | #303 | Tragic 13.1% |
| Hopi | 0.0 /100 | #304 | Tragic 13.2% |
| Chippewa | 0.0 /100 | #305 | Tragic 13.2% |
| Tlingit-Haida | 0.0 /100 | #306 | Tragic 13.2% |
| French American Indians | 0.0 /100 | #307 | Tragic 13.2% |
| Ottawa | 0.0 /100 | #308 | Tragic 13.2% |
| Americans | 0.0 /100 | #309 | Tragic 13.2% |
| Africans | 0.0 /100 | #310 | Tragic 13.2% |
| Sioux | 0.0 /100 | #311 | Tragic 13.2% |
| Blackfeet | 0.0 /100 | #312 | Tragic 13.3% |
Demographics Similar to Iraqis by Divorced or Separated
In terms of divorced or separated, the demographic groups most similar to Iraqis are Romanian (11.8%, a difference of 0.010%), Syrian (11.7%, a difference of 0.090%), Immigrants from Uganda (11.7%, a difference of 0.13%), Ecuadorian (11.7%, a difference of 0.13%), and Menominee (11.8%, a difference of 0.13%).
| Demographics | Rating | Rank | Divorced or Separated |
| Estonians | 96.6 /100 | #113 | Exceptional 11.7% |
| Immigrants | Norway | 95.9 /100 | #114 | Exceptional 11.7% |
| Lithuanians | 95.7 /100 | #115 | Exceptional 11.7% |
| Immigrants | Iraq | 95.4 /100 | #116 | Exceptional 11.7% |
| Immigrants | Uganda | 95.3 /100 | #117 | Exceptional 11.7% |
| Ecuadorians | 95.3 /100 | #118 | Exceptional 11.7% |
| Syrians | 95.1 /100 | #119 | Exceptional 11.7% |
| Iraqis | 94.6 /100 | #120 | Exceptional 11.8% |
| Romanians | 94.5 /100 | #121 | Exceptional 11.8% |
| Menominee | 93.8 /100 | #122 | Exceptional 11.8% |
| Immigrants | Immigrants | 93.7 /100 | #123 | Exceptional 11.8% |
| Ugandans | 93.1 /100 | #124 | Exceptional 11.8% |
| Ukrainians | 92.3 /100 | #125 | Exceptional 11.8% |
| South American Indians | 92.1 /100 | #126 | Exceptional 11.8% |
| South Africans | 88.9 /100 | #127 | Excellent 11.8% |