Chippewa vs Immigrants from Africa Median Household Income
COMPARE
Chippewa
Immigrants from Africa
Median Household Income
Median Household Income Comparison
Chippewa
Immigrants from Africa
$70,539
MEDIAN HOUSEHOLD INCOME
0.0/ 100
METRIC RATING
318th/ 347
METRIC RANK
$83,289
MEDIAN HOUSEHOLD INCOME
23.8/ 100
METRIC RATING
204th/ 347
METRIC RANK
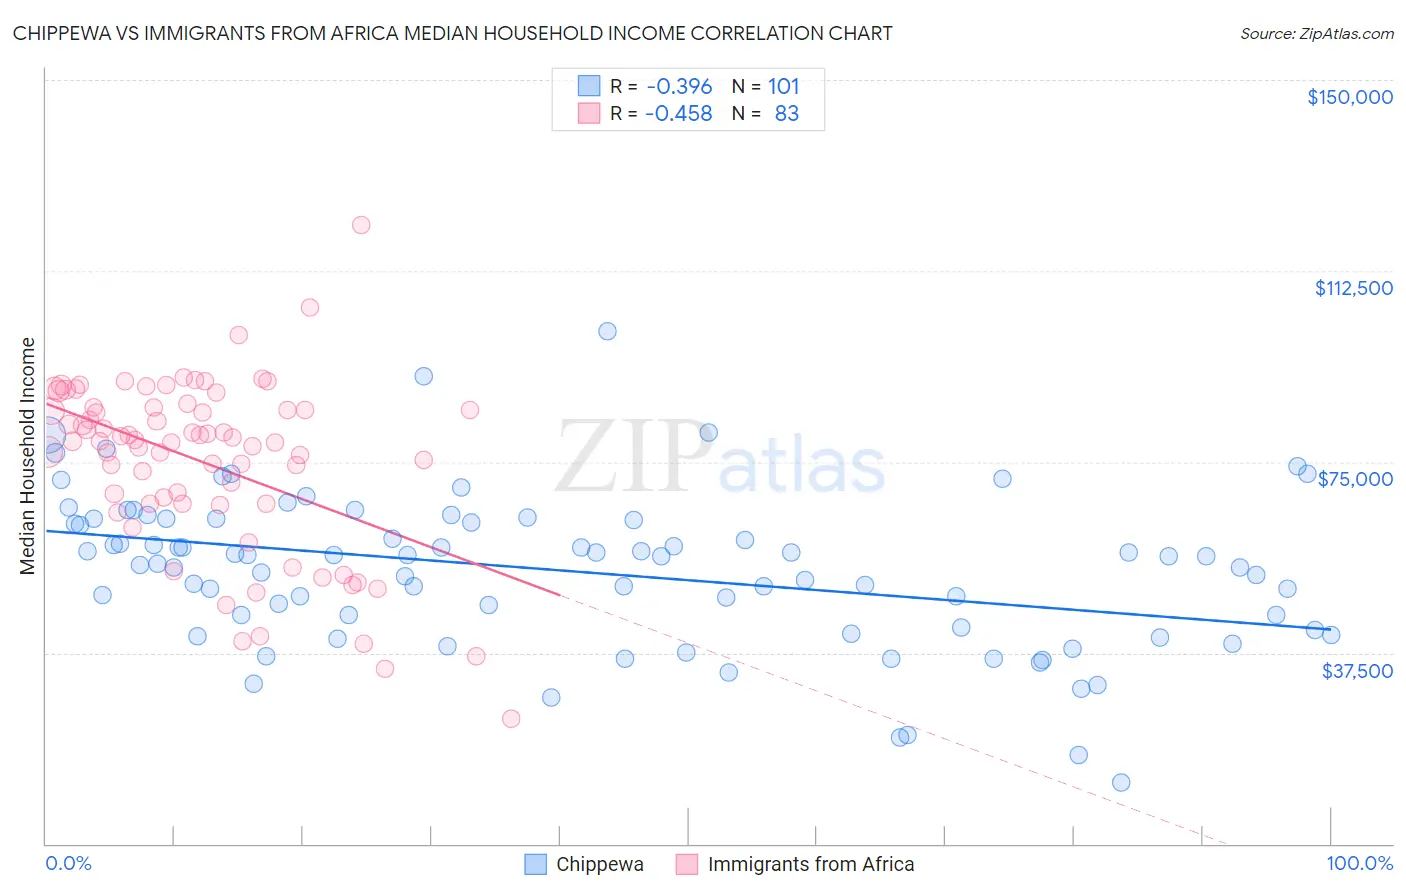
Chippewa vs Immigrants from Africa Median Household Income Correlation Chart
The statistical analysis conducted on geographies consisting of 214,988,479 people shows a mild negative correlation between the proportion of Chippewa and median household income in the United States with a correlation coefficient (R) of -0.396 and weighted average of $70,539. Similarly, the statistical analysis conducted on geographies consisting of 468,807,581 people shows a moderate negative correlation between the proportion of Immigrants from Africa and median household income in the United States with a correlation coefficient (R) of -0.458 and weighted average of $83,289, a difference of 18.1%.
Median Household Income Correlation Summary
| Measurement | Chippewa | Immigrants from Africa |
| Minimum | $12,000 | $24,660 |
| Maximum | $100,625 | $121,421 |
| Range | $88,625 | $96,761 |
| Mean | $53,554 | $74,867 |
| Median | $56,473 | $79,143 |
| Interquartile 25% (IQ1) | $42,264 | $66,824 |
| Interquartile 75% (IQ3) | $63,716 | $85,728 |
| Interquartile Range (IQR) | $21,452 | $18,904 |
| Standard Deviation (Sample) | $15,182 | $17,152 |
| Standard Deviation (Population) | $15,107 | $17,048 |
Similar Demographics by Median Household Income
Demographics Similar to Chippewa by Median Household Income
In terms of median household income, the demographic groups most similar to Chippewa are Cajun ($70,605, a difference of 0.090%), Immigrants from Dominican Republic ($70,208, a difference of 0.47%), Apache ($70,927, a difference of 0.55%), Ottawa ($70,984, a difference of 0.63%), and Colville ($70,094, a difference of 0.63%).
| Demographics | Rating | Rank | Median Household Income |
| Immigrants | Zaire | 0.0 /100 | #311 | Tragic $71,801 |
| Immigrants | Honduras | 0.0 /100 | #312 | Tragic $71,452 |
| Immigrants | Bahamas | 0.0 /100 | #313 | Tragic $71,349 |
| Dominicans | 0.0 /100 | #314 | Tragic $71,302 |
| Ottawa | 0.0 /100 | #315 | Tragic $70,984 |
| Apache | 0.0 /100 | #316 | Tragic $70,927 |
| Cajuns | 0.0 /100 | #317 | Tragic $70,605 |
| Chippewa | 0.0 /100 | #318 | Tragic $70,539 |
| Immigrants | Dominican Republic | 0.0 /100 | #319 | Tragic $70,208 |
| Colville | 0.0 /100 | #320 | Tragic $70,094 |
| Chickasaw | 0.0 /100 | #321 | Tragic $70,005 |
| Choctaw | 0.0 /100 | #322 | Tragic $69,947 |
| Bahamians | 0.0 /100 | #323 | Tragic $69,726 |
| Yup'ik | 0.0 /100 | #324 | Tragic $69,695 |
| Seminole | 0.0 /100 | #325 | Tragic $69,420 |
Demographics Similar to Immigrants from Africa by Median Household Income
In terms of median household income, the demographic groups most similar to Immigrants from Africa are Immigrants from Cambodia ($83,304, a difference of 0.020%), Immigrants from Thailand ($83,327, a difference of 0.050%), Tsimshian ($83,346, a difference of 0.070%), Spanish ($83,343, a difference of 0.070%), and German ($83,358, a difference of 0.080%).
| Demographics | Rating | Rank | Median Household Income |
| Aleuts | 25.7 /100 | #197 | Fair $83,446 |
| Japanese | 25.1 /100 | #198 | Fair $83,395 |
| Germans | 24.6 /100 | #199 | Fair $83,358 |
| Tsimshian | 24.5 /100 | #200 | Fair $83,346 |
| Spanish | 24.4 /100 | #201 | Fair $83,343 |
| Immigrants | Thailand | 24.3 /100 | #202 | Fair $83,327 |
| Immigrants | Cambodia | 24.0 /100 | #203 | Fair $83,304 |
| Immigrants | Africa | 23.8 /100 | #204 | Fair $83,289 |
| Celtics | 22.7 /100 | #205 | Fair $83,193 |
| Immigrants | Kenya | 21.3 /100 | #206 | Fair $83,068 |
| Dutch | 20.3 /100 | #207 | Fair $82,971 |
| French Canadians | 18.7 /100 | #208 | Poor $82,810 |
| Immigrants | Iraq | 16.7 /100 | #209 | Poor $82,594 |
| Immigrants | Uruguay | 16.4 /100 | #210 | Poor $82,560 |
| Salvadorans | 15.4 /100 | #211 | Poor $82,449 |