Chippewa vs Immigrants from Cuba Median Household Income
COMPARE
Chippewa
Immigrants from Cuba
Median Household Income
Median Household Income Comparison
Chippewa
Immigrants from Cuba
$70,539
MEDIAN HOUSEHOLD INCOME
0.0/ 100
METRIC RATING
318th/ 347
METRIC RANK
$68,461
MEDIAN HOUSEHOLD INCOME
0.0/ 100
METRIC RATING
327th/ 347
METRIC RANK
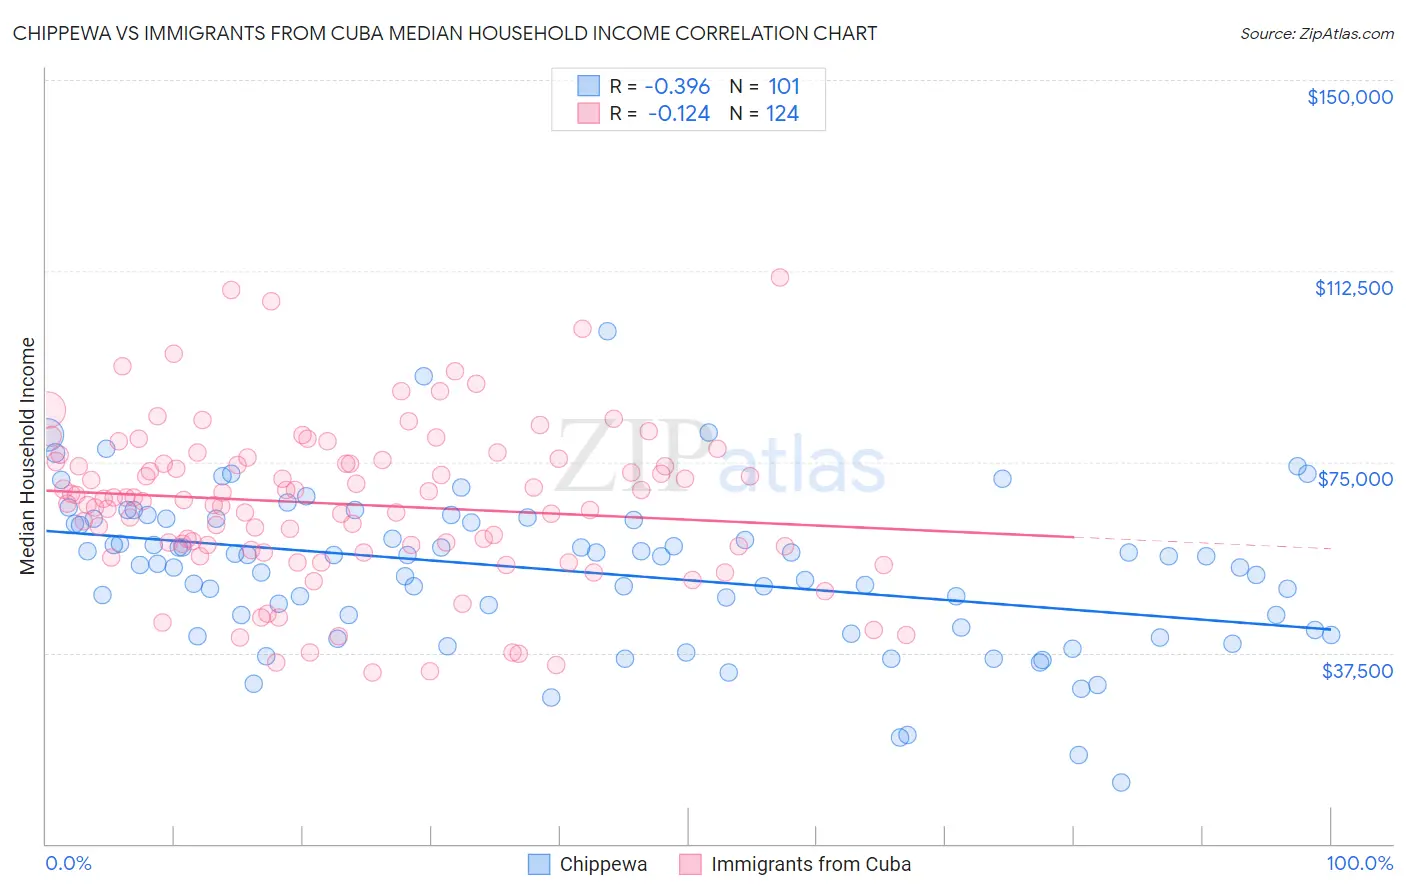
Chippewa vs Immigrants from Cuba Median Household Income Correlation Chart
The statistical analysis conducted on geographies consisting of 214,988,479 people shows a mild negative correlation between the proportion of Chippewa and median household income in the United States with a correlation coefficient (R) of -0.396 and weighted average of $70,539. Similarly, the statistical analysis conducted on geographies consisting of 325,902,946 people shows a poor negative correlation between the proportion of Immigrants from Cuba and median household income in the United States with a correlation coefficient (R) of -0.124 and weighted average of $68,461, a difference of 3.0%.
Median Household Income Correlation Summary
| Measurement | Chippewa | Immigrants from Cuba |
| Minimum | $12,000 | $33,697 |
| Maximum | $100,625 | $111,328 |
| Range | $88,625 | $77,631 |
| Mean | $53,554 | $66,701 |
| Median | $56,473 | $67,566 |
| Interquartile 25% (IQ1) | $42,264 | $57,982 |
| Interquartile 75% (IQ3) | $63,716 | $75,238 |
| Interquartile Range (IQR) | $21,452 | $17,257 |
| Standard Deviation (Sample) | $15,182 | $15,525 |
| Standard Deviation (Population) | $15,107 | $15,462 |
Demographics Similar to Chippewa and Immigrants from Cuba by Median Household Income
In terms of median household income, the demographic groups most similar to Chippewa are Cajun ($70,605, a difference of 0.090%), Immigrants from Dominican Republic ($70,208, a difference of 0.47%), Apache ($70,927, a difference of 0.55%), Ottawa ($70,984, a difference of 0.63%), and Colville ($70,094, a difference of 0.63%). Similarly, the demographic groups most similar to Immigrants from Cuba are Menominee ($68,423, a difference of 0.060%), Dutch West Indian ($68,412, a difference of 0.070%), Yuman ($68,743, a difference of 0.41%), Arapaho ($67,965, a difference of 0.73%), and Native/Alaskan ($67,879, a difference of 0.86%).
| Demographics | Rating | Rank | Median Household Income |
| Immigrants | Honduras | 0.0 /100 | #312 | Tragic $71,452 |
| Immigrants | Bahamas | 0.0 /100 | #313 | Tragic $71,349 |
| Dominicans | 0.0 /100 | #314 | Tragic $71,302 |
| Ottawa | 0.0 /100 | #315 | Tragic $70,984 |
| Apache | 0.0 /100 | #316 | Tragic $70,927 |
| Cajuns | 0.0 /100 | #317 | Tragic $70,605 |
| Chippewa | 0.0 /100 | #318 | Tragic $70,539 |
| Immigrants | Dominican Republic | 0.0 /100 | #319 | Tragic $70,208 |
| Colville | 0.0 /100 | #320 | Tragic $70,094 |
| Chickasaw | 0.0 /100 | #321 | Tragic $70,005 |
| Choctaw | 0.0 /100 | #322 | Tragic $69,947 |
| Bahamians | 0.0 /100 | #323 | Tragic $69,726 |
| Yup'ik | 0.0 /100 | #324 | Tragic $69,695 |
| Seminole | 0.0 /100 | #325 | Tragic $69,420 |
| Yuman | 0.0 /100 | #326 | Tragic $68,743 |
| Immigrants | Cuba | 0.0 /100 | #327 | Tragic $68,461 |
| Menominee | 0.0 /100 | #328 | Tragic $68,423 |
| Dutch West Indians | 0.0 /100 | #329 | Tragic $68,412 |
| Arapaho | 0.0 /100 | #330 | Tragic $67,965 |
| Natives/Alaskans | 0.0 /100 | #331 | Tragic $67,879 |
| Sioux | 0.0 /100 | #332 | Tragic $67,792 |