Chippewa vs Kiowa Median Household Income
COMPARE
Chippewa
Kiowa
Median Household Income
Median Household Income Comparison
Chippewa
Kiowa
$70,539
MEDIAN HOUSEHOLD INCOME
0.0/ 100
METRIC RATING
318th/ 347
METRIC RANK
$65,914
MEDIAN HOUSEHOLD INCOME
0.0/ 100
METRIC RATING
337th/ 347
METRIC RANK
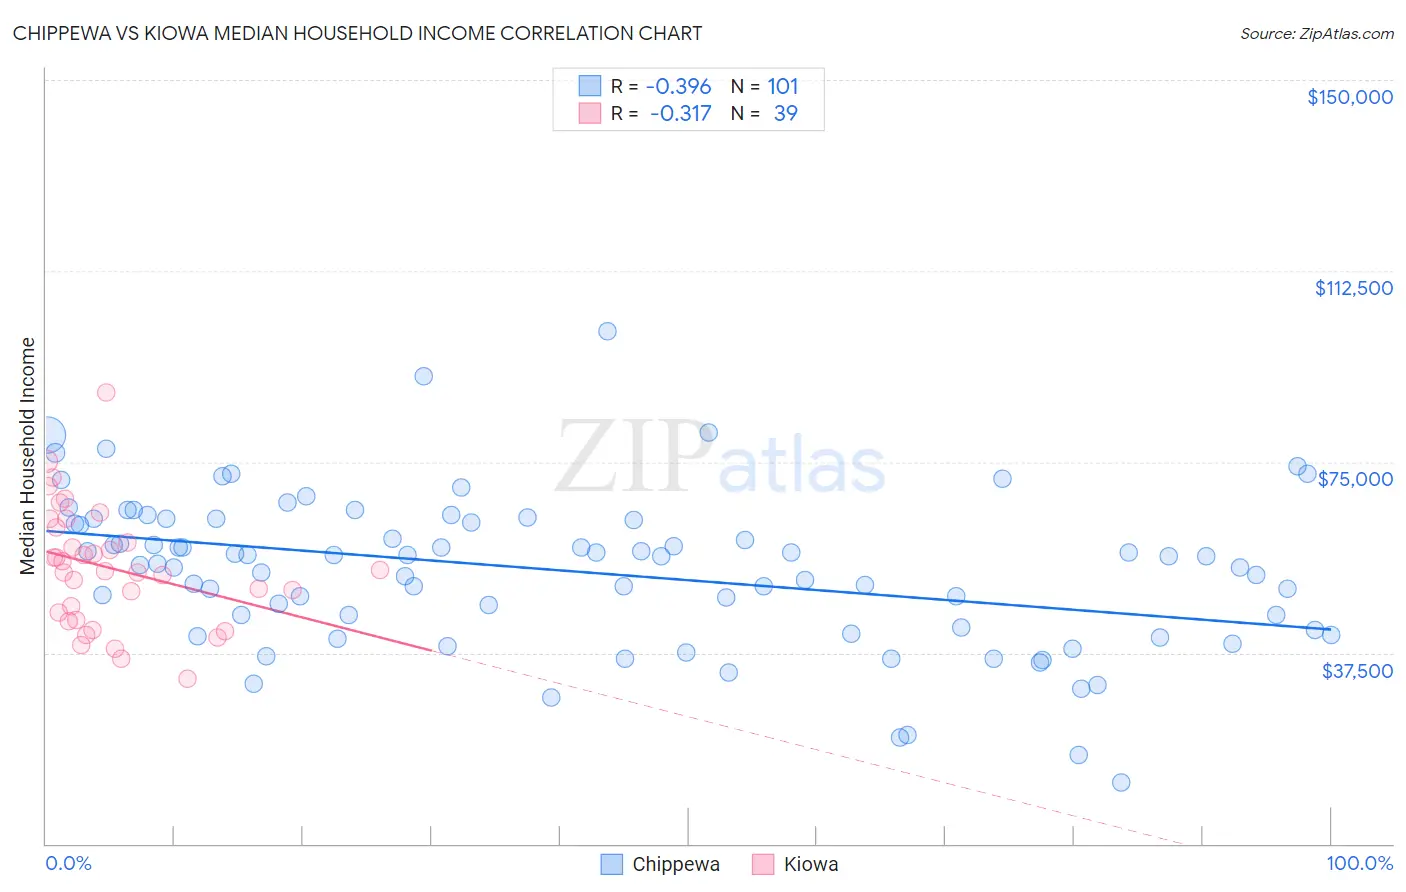
Chippewa vs Kiowa Median Household Income Correlation Chart
The statistical analysis conducted on geographies consisting of 214,988,479 people shows a mild negative correlation between the proportion of Chippewa and median household income in the United States with a correlation coefficient (R) of -0.396 and weighted average of $70,539. Similarly, the statistical analysis conducted on geographies consisting of 56,098,760 people shows a mild negative correlation between the proportion of Kiowa and median household income in the United States with a correlation coefficient (R) of -0.317 and weighted average of $65,914, a difference of 7.0%.
Median Household Income Correlation Summary
| Measurement | Chippewa | Kiowa |
| Minimum | $12,000 | $32,500 |
| Maximum | $100,625 | $88,558 |
| Range | $88,625 | $56,058 |
| Mean | $53,554 | $54,131 |
| Median | $56,473 | $53,438 |
| Interquartile 25% (IQ1) | $42,264 | $43,977 |
| Interquartile 75% (IQ3) | $63,716 | $62,181 |
| Interquartile Range (IQR) | $21,452 | $18,204 |
| Standard Deviation (Sample) | $15,182 | $11,836 |
| Standard Deviation (Population) | $15,107 | $11,684 |
Demographics Similar to Chippewa and Kiowa by Median Household Income
In terms of median household income, the demographic groups most similar to Chippewa are Cajun ($70,605, a difference of 0.090%), Immigrants from Dominican Republic ($70,208, a difference of 0.47%), Colville ($70,094, a difference of 0.63%), Chickasaw ($70,005, a difference of 0.76%), and Choctaw ($69,947, a difference of 0.85%). Similarly, the demographic groups most similar to Kiowa are Immigrants from Congo ($66,768, a difference of 1.3%), Cheyenne ($66,974, a difference of 1.6%), Black/African American ($67,573, a difference of 2.5%), Creek ($67,715, a difference of 2.7%), and Sioux ($67,792, a difference of 2.9%).
| Demographics | Rating | Rank | Median Household Income |
| Cajuns | 0.0 /100 | #317 | Tragic $70,605 |
| Chippewa | 0.0 /100 | #318 | Tragic $70,539 |
| Immigrants | Dominican Republic | 0.0 /100 | #319 | Tragic $70,208 |
| Colville | 0.0 /100 | #320 | Tragic $70,094 |
| Chickasaw | 0.0 /100 | #321 | Tragic $70,005 |
| Choctaw | 0.0 /100 | #322 | Tragic $69,947 |
| Bahamians | 0.0 /100 | #323 | Tragic $69,726 |
| Yup'ik | 0.0 /100 | #324 | Tragic $69,695 |
| Seminole | 0.0 /100 | #325 | Tragic $69,420 |
| Yuman | 0.0 /100 | #326 | Tragic $68,743 |
| Immigrants | Cuba | 0.0 /100 | #327 | Tragic $68,461 |
| Menominee | 0.0 /100 | #328 | Tragic $68,423 |
| Dutch West Indians | 0.0 /100 | #329 | Tragic $68,412 |
| Arapaho | 0.0 /100 | #330 | Tragic $67,965 |
| Natives/Alaskans | 0.0 /100 | #331 | Tragic $67,879 |
| Sioux | 0.0 /100 | #332 | Tragic $67,792 |
| Creek | 0.0 /100 | #333 | Tragic $67,715 |
| Blacks/African Americans | 0.0 /100 | #334 | Tragic $67,573 |
| Cheyenne | 0.0 /100 | #335 | Tragic $66,974 |
| Immigrants | Congo | 0.0 /100 | #336 | Tragic $66,768 |
| Kiowa | 0.0 /100 | #337 | Tragic $65,914 |