Serbian vs Immigrants from Africa Median Household Income
COMPARE
Serbian
Immigrants from Africa
Median Household Income
Median Household Income Comparison
Serbians
Immigrants from Africa
$87,572
MEDIAN HOUSEHOLD INCOME
83.0/ 100
METRIC RATING
144th/ 347
METRIC RANK
$83,289
MEDIAN HOUSEHOLD INCOME
23.8/ 100
METRIC RATING
204th/ 347
METRIC RANK
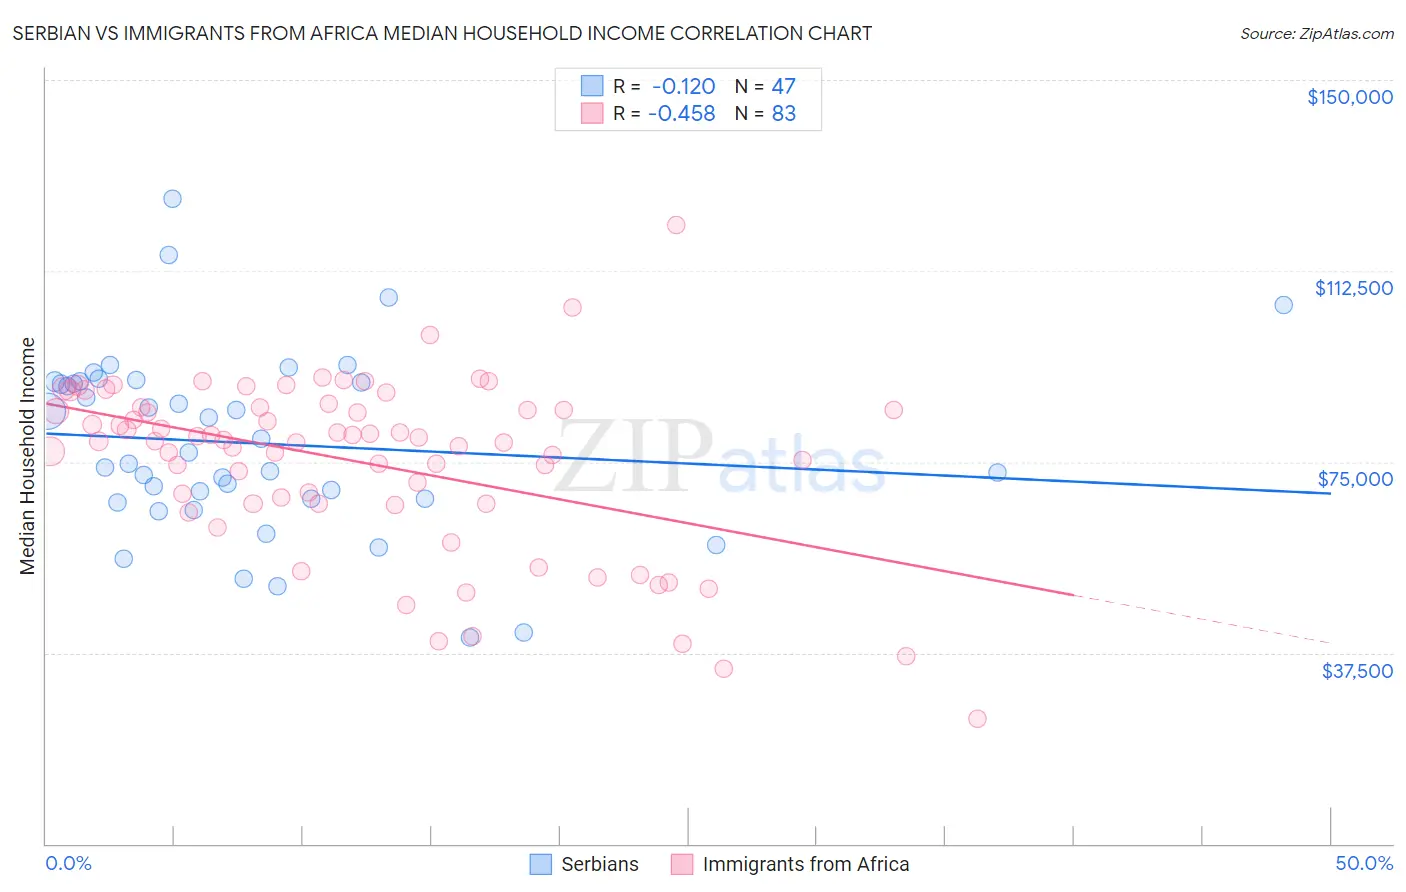
Serbian vs Immigrants from Africa Median Household Income Correlation Chart
The statistical analysis conducted on geographies consisting of 267,501,646 people shows a poor negative correlation between the proportion of Serbians and median household income in the United States with a correlation coefficient (R) of -0.120 and weighted average of $87,572. Similarly, the statistical analysis conducted on geographies consisting of 468,807,581 people shows a moderate negative correlation between the proportion of Immigrants from Africa and median household income in the United States with a correlation coefficient (R) of -0.458 and weighted average of $83,289, a difference of 5.1%.
Median Household Income Correlation Summary
| Measurement | Serbian | Immigrants from Africa |
| Minimum | $40,500 | $24,660 |
| Maximum | $126,567 | $121,421 |
| Range | $86,067 | $96,761 |
| Mean | $78,611 | $74,867 |
| Median | $76,777 | $79,143 |
| Interquartile 25% (IQ1) | $67,750 | $66,824 |
| Interquartile 75% (IQ3) | $90,729 | $85,728 |
| Interquartile Range (IQR) | $22,979 | $18,904 |
| Standard Deviation (Sample) | $17,894 | $17,152 |
| Standard Deviation (Population) | $17,703 | $17,048 |
Similar Demographics by Median Household Income
Demographics Similar to Serbians by Median Household Income
In terms of median household income, the demographic groups most similar to Serbians are Ugandan ($87,557, a difference of 0.020%), Immigrants from Uganda ($87,553, a difference of 0.020%), Danish ($87,676, a difference of 0.12%), South American Indian ($87,446, a difference of 0.14%), and Canadian ($87,769, a difference of 0.22%).
| Demographics | Rating | Rank | Median Household Income |
| Sierra Leoneans | 89.6 /100 | #137 | Excellent $88,463 |
| Arabs | 89.2 /100 | #138 | Excellent $88,398 |
| Immigrants | Chile | 89.2 /100 | #139 | Excellent $88,388 |
| Lebanese | 87.2 /100 | #140 | Excellent $88,091 |
| Immigrants | Morocco | 86.0 /100 | #141 | Excellent $87,930 |
| Canadians | 84.7 /100 | #142 | Excellent $87,769 |
| Danes | 83.9 /100 | #143 | Excellent $87,676 |
| Serbians | 83.0 /100 | #144 | Excellent $87,572 |
| Ugandans | 82.9 /100 | #145 | Excellent $87,557 |
| Immigrants | Uganda | 82.8 /100 | #146 | Excellent $87,553 |
| South American Indians | 81.8 /100 | #147 | Excellent $87,446 |
| Costa Ricans | 80.0 /100 | #148 | Excellent $87,262 |
| Immigrants | Nepal | 77.7 /100 | #149 | Good $87,046 |
| Basques | 77.2 /100 | #150 | Good $87,001 |
| Hungarians | 76.3 /100 | #151 | Good $86,920 |
Demographics Similar to Immigrants from Africa by Median Household Income
In terms of median household income, the demographic groups most similar to Immigrants from Africa are Immigrants from Cambodia ($83,304, a difference of 0.020%), Immigrants from Thailand ($83,327, a difference of 0.050%), Tsimshian ($83,346, a difference of 0.070%), Spanish ($83,343, a difference of 0.070%), and German ($83,358, a difference of 0.080%).
| Demographics | Rating | Rank | Median Household Income |
| Aleuts | 25.7 /100 | #197 | Fair $83,446 |
| Japanese | 25.1 /100 | #198 | Fair $83,395 |
| Germans | 24.6 /100 | #199 | Fair $83,358 |
| Tsimshian | 24.5 /100 | #200 | Fair $83,346 |
| Spanish | 24.4 /100 | #201 | Fair $83,343 |
| Immigrants | Thailand | 24.3 /100 | #202 | Fair $83,327 |
| Immigrants | Cambodia | 24.0 /100 | #203 | Fair $83,304 |
| Immigrants | Africa | 23.8 /100 | #204 | Fair $83,289 |
| Celtics | 22.7 /100 | #205 | Fair $83,193 |
| Immigrants | Kenya | 21.3 /100 | #206 | Fair $83,068 |
| Dutch | 20.3 /100 | #207 | Fair $82,971 |
| French Canadians | 18.7 /100 | #208 | Poor $82,810 |
| Immigrants | Iraq | 16.7 /100 | #209 | Poor $82,594 |
| Immigrants | Uruguay | 16.4 /100 | #210 | Poor $82,560 |
| Salvadorans | 15.4 /100 | #211 | Poor $82,449 |