Chippewa vs Immigrants from Africa 5th Grade
COMPARE
Chippewa
Immigrants from Africa
5th Grade
5th Grade Comparison
Chippewa
Immigrants from Africa
98.1%
5TH GRADE
100.0/ 100
METRIC RATING
32nd/ 347
METRIC RANK
96.9%
5TH GRADE
1.1/ 100
METRIC RATING
247th/ 347
METRIC RANK
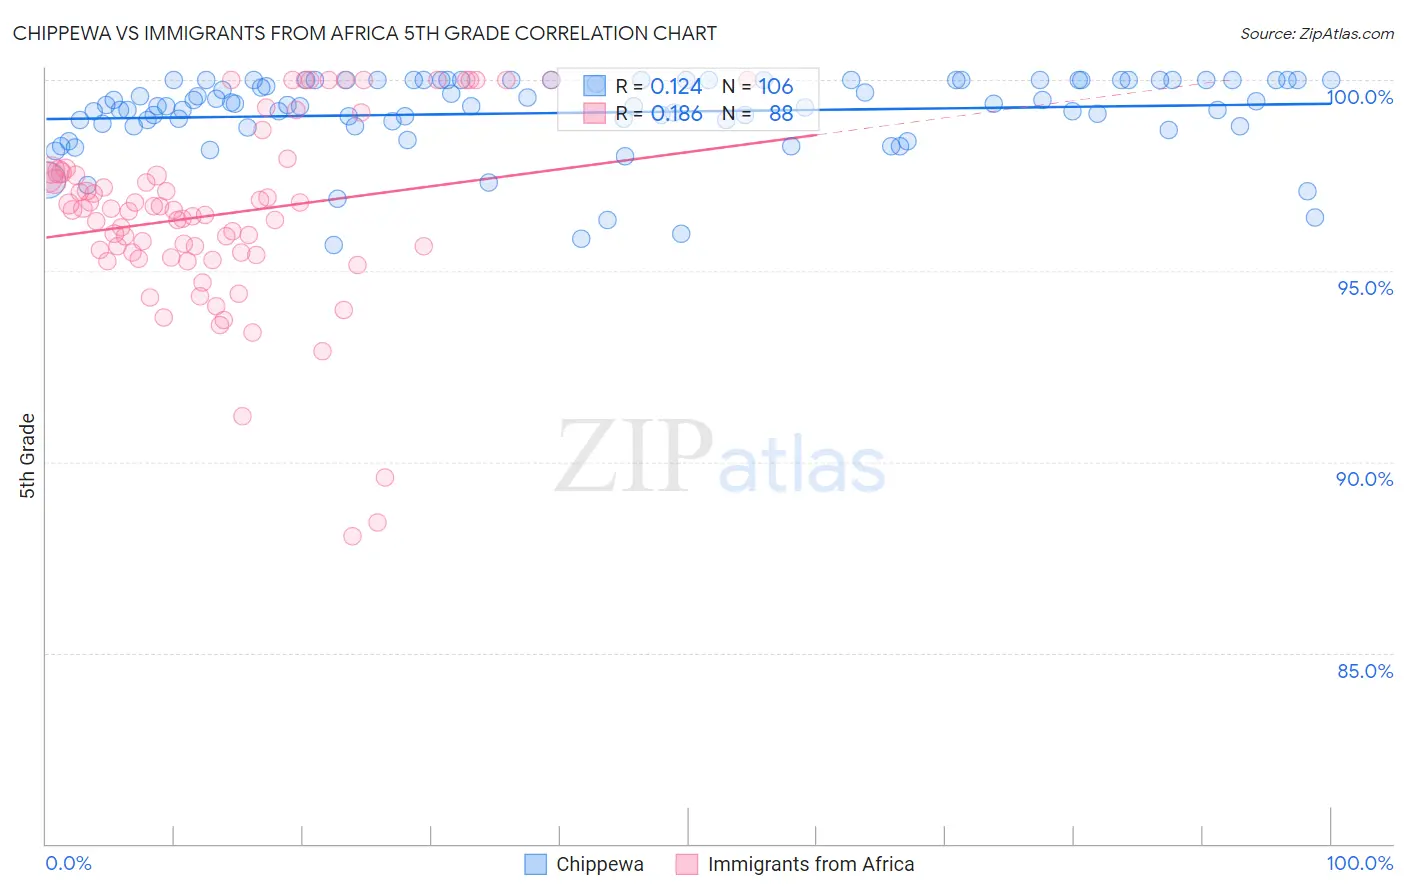
Chippewa vs Immigrants from Africa 5th Grade Correlation Chart
The statistical analysis conducted on geographies consisting of 215,065,644 people shows a poor positive correlation between the proportion of Chippewa and percentage of population with at least 5th grade education in the United States with a correlation coefficient (R) of 0.124 and weighted average of 98.1%. Similarly, the statistical analysis conducted on geographies consisting of 469,408,495 people shows a poor positive correlation between the proportion of Immigrants from Africa and percentage of population with at least 5th grade education in the United States with a correlation coefficient (R) of 0.186 and weighted average of 96.9%, a difference of 1.3%.
5th Grade Correlation Summary
| Measurement | Chippewa | Immigrants from Africa |
| Minimum | 95.7% | 88.1% |
| Maximum | 100.0% | 100.0% |
| Range | 4.3% | 11.9% |
| Mean | 99.1% | 96.5% |
| Median | 99.3% | 96.6% |
| Interquartile 25% (IQ1) | 98.9% | 95.4% |
| Interquartile 75% (IQ3) | 100.0% | 97.6% |
| Interquartile Range (IQR) | 1.1% | 2.1% |
| Standard Deviation (Sample) | 1.0% | 2.4% |
| Standard Deviation (Population) | 1.0% | 2.4% |
Similar Demographics by 5th Grade
Demographics Similar to Chippewa by 5th Grade
In terms of 5th grade, the demographic groups most similar to Chippewa are Swiss (98.1%, a difference of 0.010%), Chinese (98.1%, a difference of 0.010%), Italian (98.1%, a difference of 0.020%), British (98.1%, a difference of 0.030%), and European (98.2%, a difference of 0.040%).
| Demographics | Rating | Rank | 5th Grade |
| Yup'ik | 100.0 /100 | #25 | Exceptional 98.2% |
| Alaska Natives | 100.0 /100 | #26 | Exceptional 98.2% |
| French | 100.0 /100 | #27 | Exceptional 98.2% |
| Czechs | 100.0 /100 | #28 | Exceptional 98.2% |
| Scandinavians | 100.0 /100 | #29 | Exceptional 98.2% |
| French Canadians | 100.0 /100 | #30 | Exceptional 98.2% |
| Europeans | 100.0 /100 | #31 | Exceptional 98.2% |
| Chippewa | 100.0 /100 | #32 | Exceptional 98.1% |
| Swiss | 100.0 /100 | #33 | Exceptional 98.1% |
| Chinese | 100.0 /100 | #34 | Exceptional 98.1% |
| Italians | 100.0 /100 | #35 | Exceptional 98.1% |
| British | 100.0 /100 | #36 | Exceptional 98.1% |
| Latvians | 99.9 /100 | #37 | Exceptional 98.1% |
| Belgians | 99.9 /100 | #38 | Exceptional 98.1% |
| Luxembourgers | 99.9 /100 | #39 | Exceptional 98.1% |
Demographics Similar to Immigrants from Africa by 5th Grade
In terms of 5th grade, the demographic groups most similar to Immigrants from Africa are U.S. Virgin Islander (96.9%, a difference of 0.0%), Ethiopian (96.9%, a difference of 0.010%), Immigrants from Uruguay (96.9%, a difference of 0.010%), Immigrants from Liberia (96.9%, a difference of 0.010%), and Bolivian (96.9%, a difference of 0.010%).
| Demographics | Rating | Rank | 5th Grade |
| Indians (Asian) | 1.9 /100 | #240 | Tragic 96.9% |
| Immigrants | Asia | 1.7 /100 | #241 | Tragic 96.9% |
| Immigrants | Costa Rica | 1.6 /100 | #242 | Tragic 96.9% |
| Immigrants | Eastern Africa | 1.6 /100 | #243 | Tragic 96.9% |
| Koreans | 1.6 /100 | #244 | Tragic 96.9% |
| Colombians | 1.3 /100 | #245 | Tragic 96.9% |
| Ethiopians | 1.2 /100 | #246 | Tragic 96.9% |
| Immigrants | Africa | 1.1 /100 | #247 | Tragic 96.9% |
| U.S. Virgin Islanders | 1.1 /100 | #248 | Tragic 96.9% |
| Immigrants | Uruguay | 1.0 /100 | #249 | Tragic 96.9% |
| Immigrants | Liberia | 1.0 /100 | #250 | Tragic 96.9% |
| Bolivians | 0.9 /100 | #251 | Tragic 96.9% |
| Jamaicans | 0.9 /100 | #252 | Tragic 96.9% |
| Immigrants | Middle Africa | 0.8 /100 | #253 | Tragic 96.8% |
| Immigrants | Senegal | 0.8 /100 | #254 | Tragic 96.8% |