Pima vs Immigrants from Africa Median Household Income
COMPARE
Pima
Immigrants from Africa
Median Household Income
Median Household Income Comparison
Pima
Immigrants from Africa
$63,262
MEDIAN HOUSEHOLD INCOME
0.0/ 100
METRIC RATING
342nd/ 347
METRIC RANK
$83,289
MEDIAN HOUSEHOLD INCOME
23.8/ 100
METRIC RATING
204th/ 347
METRIC RANK
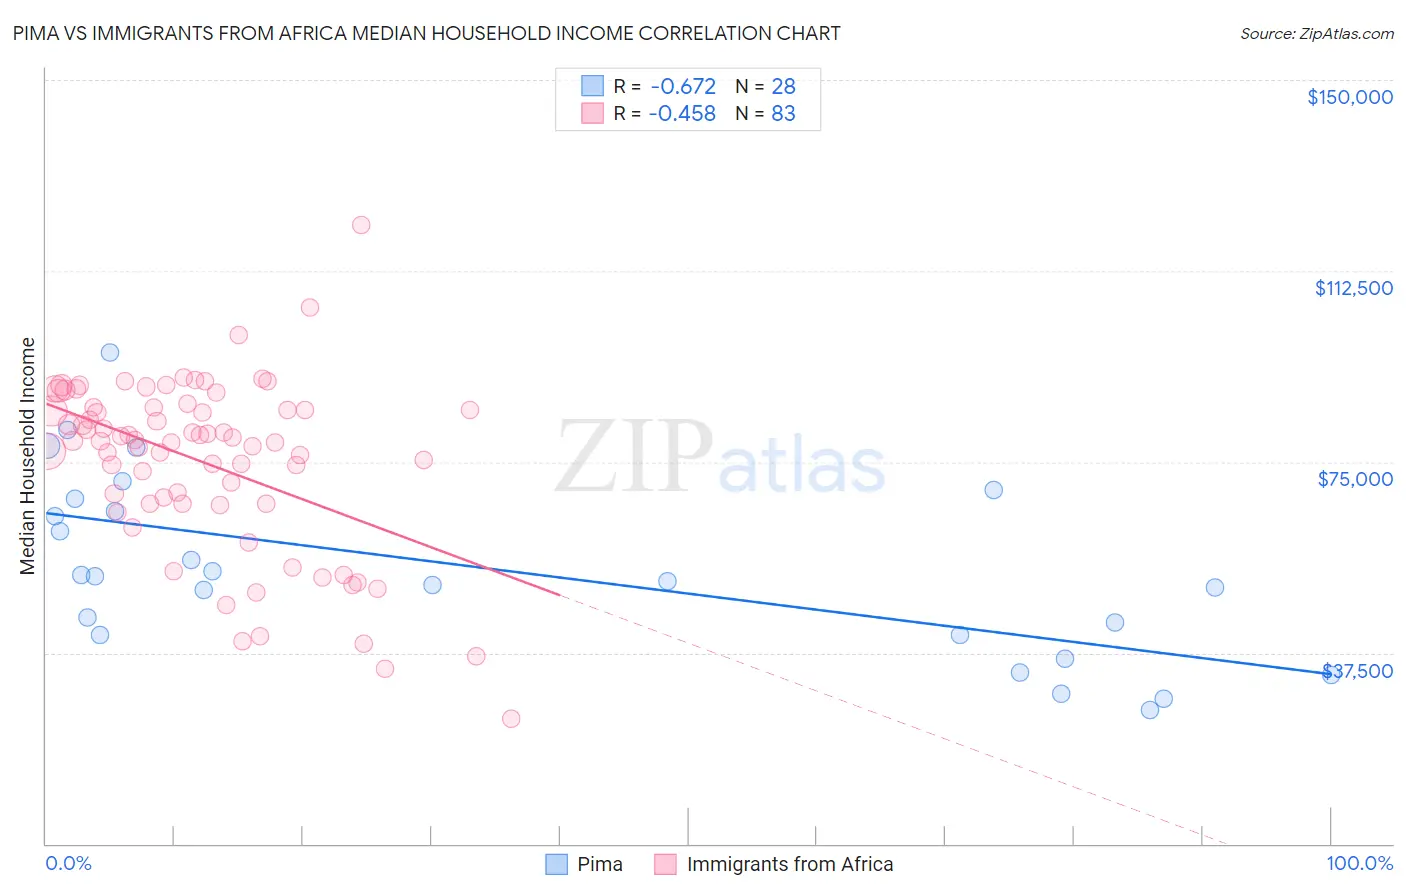
Pima vs Immigrants from Africa Median Household Income Correlation Chart
The statistical analysis conducted on geographies consisting of 61,537,269 people shows a significant negative correlation between the proportion of Pima and median household income in the United States with a correlation coefficient (R) of -0.672 and weighted average of $63,262. Similarly, the statistical analysis conducted on geographies consisting of 468,807,581 people shows a moderate negative correlation between the proportion of Immigrants from Africa and median household income in the United States with a correlation coefficient (R) of -0.458 and weighted average of $83,289, a difference of 31.7%.
Median Household Income Correlation Summary
| Measurement | Pima | Immigrants from Africa |
| Minimum | $26,339 | $24,660 |
| Maximum | $96,415 | $121,421 |
| Range | $70,076 | $96,761 |
| Mean | $53,826 | $74,867 |
| Median | $52,032 | $79,143 |
| Interquartile 25% (IQ1) | $40,965 | $66,824 |
| Interquartile 75% (IQ3) | $66,485 | $85,728 |
| Interquartile Range (IQR) | $25,519 | $18,904 |
| Standard Deviation (Sample) | $17,724 | $17,152 |
| Standard Deviation (Population) | $17,405 | $17,048 |
Similar Demographics by Median Household Income
Demographics Similar to Pima by Median Household Income
In terms of median household income, the demographic groups most similar to Pima are Crow ($63,681, a difference of 0.66%), Houma ($62,575, a difference of 1.1%), Pueblo ($64,692, a difference of 2.3%), Tohono O'odham ($61,663, a difference of 2.6%), and Hopi ($65,043, a difference of 2.8%).
| Demographics | Rating | Rank | Median Household Income |
| Creek | 0.0 /100 | #333 | Tragic $67,715 |
| Blacks/African Americans | 0.0 /100 | #334 | Tragic $67,573 |
| Cheyenne | 0.0 /100 | #335 | Tragic $66,974 |
| Immigrants | Congo | 0.0 /100 | #336 | Tragic $66,768 |
| Kiowa | 0.0 /100 | #337 | Tragic $65,914 |
| Immigrants | Yemen | 0.0 /100 | #338 | Tragic $65,194 |
| Hopi | 0.0 /100 | #339 | Tragic $65,043 |
| Pueblo | 0.0 /100 | #340 | Tragic $64,692 |
| Crow | 0.0 /100 | #341 | Tragic $63,681 |
| Pima | 0.0 /100 | #342 | Tragic $63,262 |
| Houma | 0.0 /100 | #343 | Tragic $62,575 |
| Tohono O'odham | 0.0 /100 | #344 | Tragic $61,663 |
| Puerto Ricans | 0.0 /100 | #345 | Tragic $59,197 |
| Navajo | 0.0 /100 | #346 | Tragic $59,159 |
| Lumbee | 0.0 /100 | #347 | Tragic $54,644 |
Demographics Similar to Immigrants from Africa by Median Household Income
In terms of median household income, the demographic groups most similar to Immigrants from Africa are Immigrants from Cambodia ($83,304, a difference of 0.020%), Immigrants from Thailand ($83,327, a difference of 0.050%), Tsimshian ($83,346, a difference of 0.070%), Spanish ($83,343, a difference of 0.070%), and German ($83,358, a difference of 0.080%).
| Demographics | Rating | Rank | Median Household Income |
| Aleuts | 25.7 /100 | #197 | Fair $83,446 |
| Japanese | 25.1 /100 | #198 | Fair $83,395 |
| Germans | 24.6 /100 | #199 | Fair $83,358 |
| Tsimshian | 24.5 /100 | #200 | Fair $83,346 |
| Spanish | 24.4 /100 | #201 | Fair $83,343 |
| Immigrants | Thailand | 24.3 /100 | #202 | Fair $83,327 |
| Immigrants | Cambodia | 24.0 /100 | #203 | Fair $83,304 |
| Immigrants | Africa | 23.8 /100 | #204 | Fair $83,289 |
| Celtics | 22.7 /100 | #205 | Fair $83,193 |
| Immigrants | Kenya | 21.3 /100 | #206 | Fair $83,068 |
| Dutch | 20.3 /100 | #207 | Fair $82,971 |
| French Canadians | 18.7 /100 | #208 | Poor $82,810 |
| Immigrants | Iraq | 16.7 /100 | #209 | Poor $82,594 |
| Immigrants | Uruguay | 16.4 /100 | #210 | Poor $82,560 |
| Salvadorans | 15.4 /100 | #211 | Poor $82,449 |