Chippewa vs West Indian Median Household Income
COMPARE
Chippewa
West Indian
Median Household Income
Median Household Income Comparison
Chippewa
West Indians
$70,539
MEDIAN HOUSEHOLD INCOME
0.0/ 100
METRIC RATING
318th/ 347
METRIC RANK
$78,455
MEDIAN HOUSEHOLD INCOME
1.4/ 100
METRIC RATING
249th/ 347
METRIC RANK
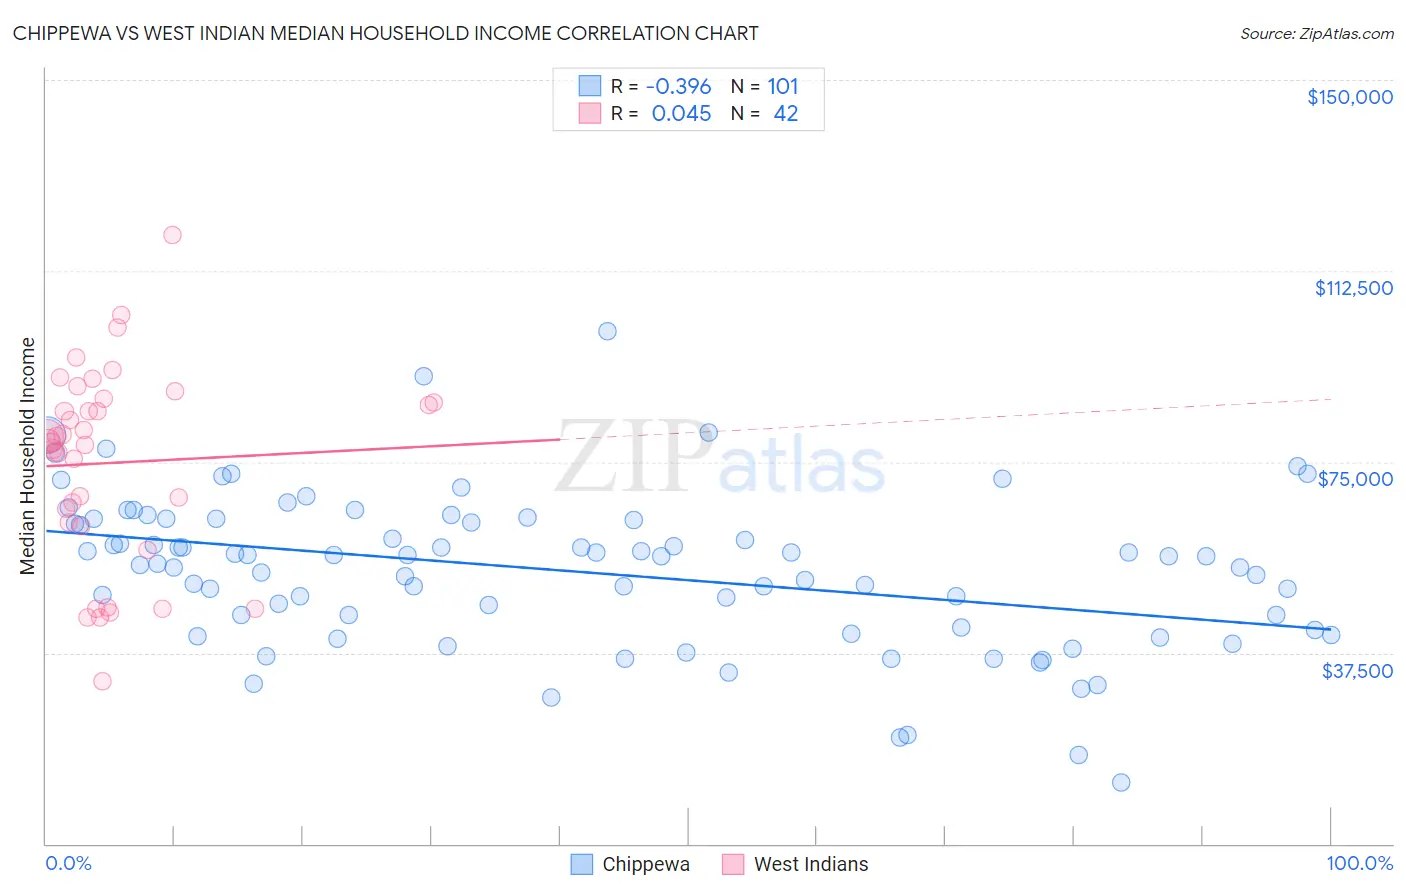
Chippewa vs West Indian Median Household Income Correlation Chart
The statistical analysis conducted on geographies consisting of 214,988,479 people shows a mild negative correlation between the proportion of Chippewa and median household income in the United States with a correlation coefficient (R) of -0.396 and weighted average of $70,539. Similarly, the statistical analysis conducted on geographies consisting of 253,821,014 people shows no correlation between the proportion of West Indians and median household income in the United States with a correlation coefficient (R) of 0.045 and weighted average of $78,455, a difference of 11.2%.
Median Household Income Correlation Summary
| Measurement | Chippewa | West Indian |
| Minimum | $12,000 | $31,916 |
| Maximum | $100,625 | $119,474 |
| Range | $88,625 | $87,558 |
| Mean | $53,554 | $74,809 |
| Median | $56,473 | $79,024 |
| Interquartile 25% (IQ1) | $42,264 | $62,987 |
| Interquartile 75% (IQ3) | $63,716 | $86,556 |
| Interquartile Range (IQR) | $21,452 | $23,569 |
| Standard Deviation (Sample) | $15,182 | $19,069 |
| Standard Deviation (Population) | $15,107 | $18,840 |
Similar Demographics by Median Household Income
Demographics Similar to Chippewa by Median Household Income
In terms of median household income, the demographic groups most similar to Chippewa are Cajun ($70,605, a difference of 0.090%), Immigrants from Dominican Republic ($70,208, a difference of 0.47%), Apache ($70,927, a difference of 0.55%), Ottawa ($70,984, a difference of 0.63%), and Colville ($70,094, a difference of 0.63%).
| Demographics | Rating | Rank | Median Household Income |
| Immigrants | Zaire | 0.0 /100 | #311 | Tragic $71,801 |
| Immigrants | Honduras | 0.0 /100 | #312 | Tragic $71,452 |
| Immigrants | Bahamas | 0.0 /100 | #313 | Tragic $71,349 |
| Dominicans | 0.0 /100 | #314 | Tragic $71,302 |
| Ottawa | 0.0 /100 | #315 | Tragic $70,984 |
| Apache | 0.0 /100 | #316 | Tragic $70,927 |
| Cajuns | 0.0 /100 | #317 | Tragic $70,605 |
| Chippewa | 0.0 /100 | #318 | Tragic $70,539 |
| Immigrants | Dominican Republic | 0.0 /100 | #319 | Tragic $70,208 |
| Colville | 0.0 /100 | #320 | Tragic $70,094 |
| Chickasaw | 0.0 /100 | #321 | Tragic $70,005 |
| Choctaw | 0.0 /100 | #322 | Tragic $69,947 |
| Bahamians | 0.0 /100 | #323 | Tragic $69,726 |
| Yup'ik | 0.0 /100 | #324 | Tragic $69,695 |
| Seminole | 0.0 /100 | #325 | Tragic $69,420 |
Demographics Similar to West Indians by Median Household Income
In terms of median household income, the demographic groups most similar to West Indians are Sudanese ($78,529, a difference of 0.090%), Immigrants from Laos ($78,327, a difference of 0.16%), Immigrants from Burma/Myanmar ($78,682, a difference of 0.29%), Mexican American Indian ($78,166, a difference of 0.37%), and Central American ($78,803, a difference of 0.44%).
| Demographics | Rating | Rank | Median Household Income |
| Immigrants | Sudan | 2.1 /100 | #242 | Tragic $79,103 |
| Immigrants | Barbados | 1.9 /100 | #243 | Tragic $78,989 |
| Marshallese | 1.9 /100 | #244 | Tragic $78,930 |
| Inupiat | 1.8 /100 | #245 | Tragic $78,841 |
| Central Americans | 1.7 /100 | #246 | Tragic $78,803 |
| Immigrants | Burma/Myanmar | 1.6 /100 | #247 | Tragic $78,682 |
| Sudanese | 1.5 /100 | #248 | Tragic $78,529 |
| West Indians | 1.4 /100 | #249 | Tragic $78,455 |
| Immigrants | Laos | 1.3 /100 | #250 | Tragic $78,327 |
| Mexican American Indians | 1.2 /100 | #251 | Tragic $78,166 |
| Immigrants | West Indies | 1.0 /100 | #252 | Tragic $77,956 |
| Immigrants | St. Vincent and the Grenadines | 0.9 /100 | #253 | Tragic $77,690 |
| Sub-Saharan Africans | 0.8 /100 | #254 | Tragic $77,631 |
| Immigrants | Middle Africa | 0.8 /100 | #255 | Tragic $77,559 |
| Belizeans | 0.6 /100 | #256 | Tragic $77,028 |