Chippewa vs Immigrants from Haiti Median Household Income
COMPARE
Chippewa
Immigrants from Haiti
Median Household Income
Median Household Income Comparison
Chippewa
Immigrants from Haiti
$70,539
MEDIAN HOUSEHOLD INCOME
0.0/ 100
METRIC RATING
318th/ 347
METRIC RANK
$72,599
MEDIAN HOUSEHOLD INCOME
0.0/ 100
METRIC RATING
304th/ 347
METRIC RANK
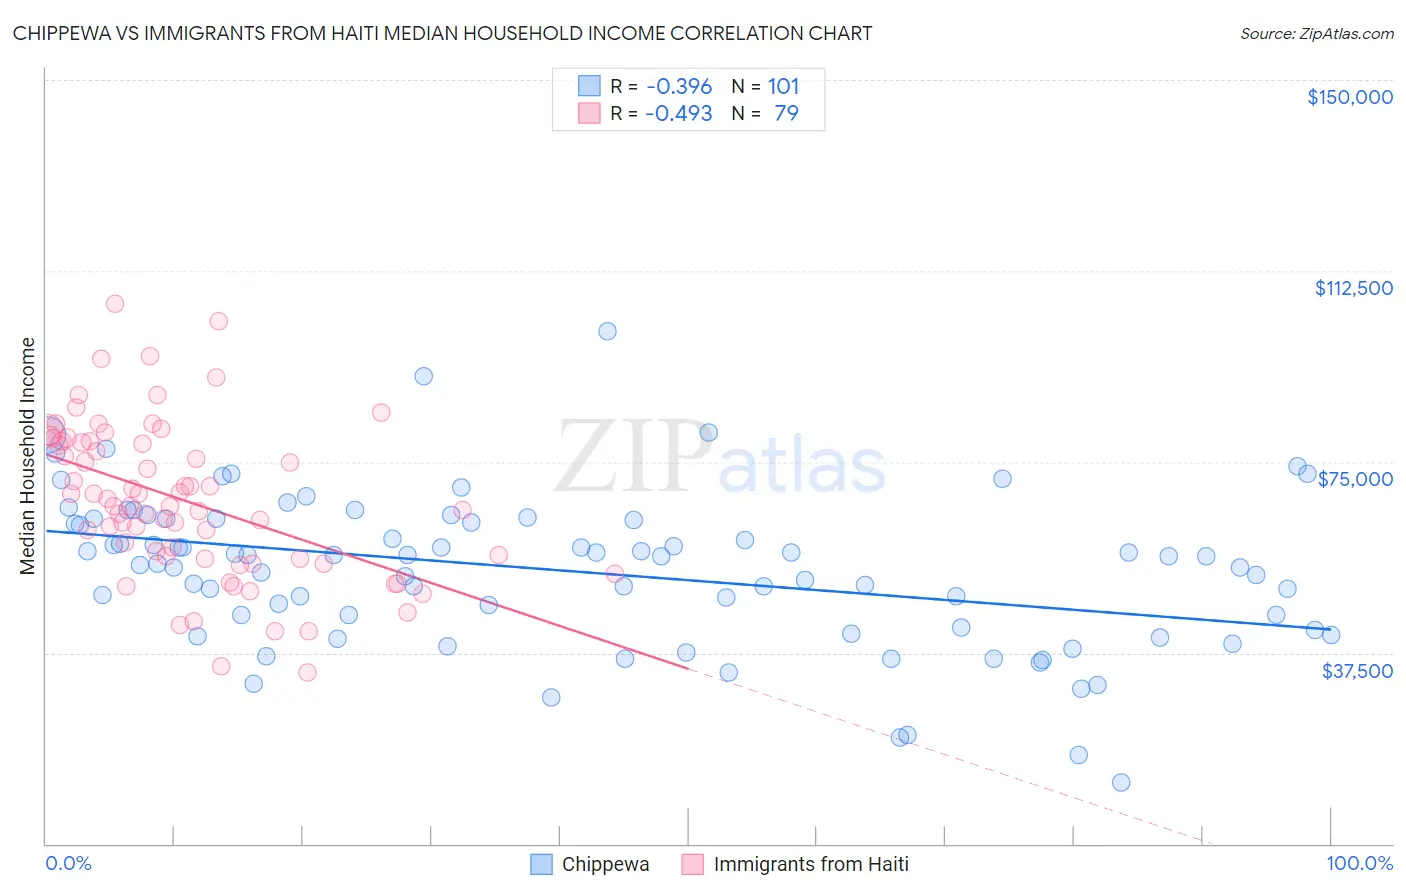
Chippewa vs Immigrants from Haiti Median Household Income Correlation Chart
The statistical analysis conducted on geographies consisting of 214,988,479 people shows a mild negative correlation between the proportion of Chippewa and median household income in the United States with a correlation coefficient (R) of -0.396 and weighted average of $70,539. Similarly, the statistical analysis conducted on geographies consisting of 225,133,235 people shows a moderate negative correlation between the proportion of Immigrants from Haiti and median household income in the United States with a correlation coefficient (R) of -0.493 and weighted average of $72,599, a difference of 2.9%.
Median Household Income Correlation Summary
| Measurement | Chippewa | Immigrants from Haiti |
| Minimum | $12,000 | $33,629 |
| Maximum | $100,625 | $105,986 |
| Range | $88,625 | $72,357 |
| Mean | $53,554 | $67,399 |
| Median | $56,473 | $66,369 |
| Interquartile 25% (IQ1) | $42,264 | $56,044 |
| Interquartile 75% (IQ3) | $63,716 | $78,973 |
| Interquartile Range (IQR) | $21,452 | $22,929 |
| Standard Deviation (Sample) | $15,182 | $15,193 |
| Standard Deviation (Population) | $15,107 | $15,096 |
Demographics Similar to Chippewa and Immigrants from Haiti by Median Household Income
In terms of median household income, the demographic groups most similar to Chippewa are Cajun ($70,605, a difference of 0.090%), Immigrants from Dominican Republic ($70,208, a difference of 0.47%), Apache ($70,927, a difference of 0.55%), Ottawa ($70,984, a difference of 0.63%), and Colville ($70,094, a difference of 0.63%). Similarly, the demographic groups most similar to Immigrants from Haiti are Honduran ($72,588, a difference of 0.020%), Potawatomi ($72,576, a difference of 0.030%), African ($72,650, a difference of 0.070%), Shoshone ($72,660, a difference of 0.080%), and Cherokee ($72,682, a difference of 0.11%).
| Demographics | Rating | Rank | Median Household Income |
| Cherokee | 0.0 /100 | #301 | Tragic $72,682 |
| Shoshone | 0.0 /100 | #302 | Tragic $72,660 |
| Africans | 0.0 /100 | #303 | Tragic $72,650 |
| Immigrants | Haiti | 0.0 /100 | #304 | Tragic $72,599 |
| Hondurans | 0.0 /100 | #305 | Tragic $72,588 |
| Potawatomi | 0.0 /100 | #306 | Tragic $72,576 |
| Ute | 0.0 /100 | #307 | Tragic $72,402 |
| Yakama | 0.0 /100 | #308 | Tragic $72,225 |
| Immigrants | Caribbean | 0.0 /100 | #309 | Tragic $71,860 |
| U.S. Virgin Islanders | 0.0 /100 | #310 | Tragic $71,853 |
| Immigrants | Zaire | 0.0 /100 | #311 | Tragic $71,801 |
| Immigrants | Honduras | 0.0 /100 | #312 | Tragic $71,452 |
| Immigrants | Bahamas | 0.0 /100 | #313 | Tragic $71,349 |
| Dominicans | 0.0 /100 | #314 | Tragic $71,302 |
| Ottawa | 0.0 /100 | #315 | Tragic $70,984 |
| Apache | 0.0 /100 | #316 | Tragic $70,927 |
| Cajuns | 0.0 /100 | #317 | Tragic $70,605 |
| Chippewa | 0.0 /100 | #318 | Tragic $70,539 |
| Immigrants | Dominican Republic | 0.0 /100 | #319 | Tragic $70,208 |
| Colville | 0.0 /100 | #320 | Tragic $70,094 |
| Chickasaw | 0.0 /100 | #321 | Tragic $70,005 |