Chippewa vs Guyanese Median Household Income
COMPARE
Chippewa
Guyanese
Median Household Income
Median Household Income Comparison
Chippewa
Guyanese
$70,539
MEDIAN HOUSEHOLD INCOME
0.0/ 100
METRIC RATING
318th/ 347
METRIC RANK
$80,734
MEDIAN HOUSEHOLD INCOME
5.7/ 100
METRIC RATING
227th/ 347
METRIC RANK
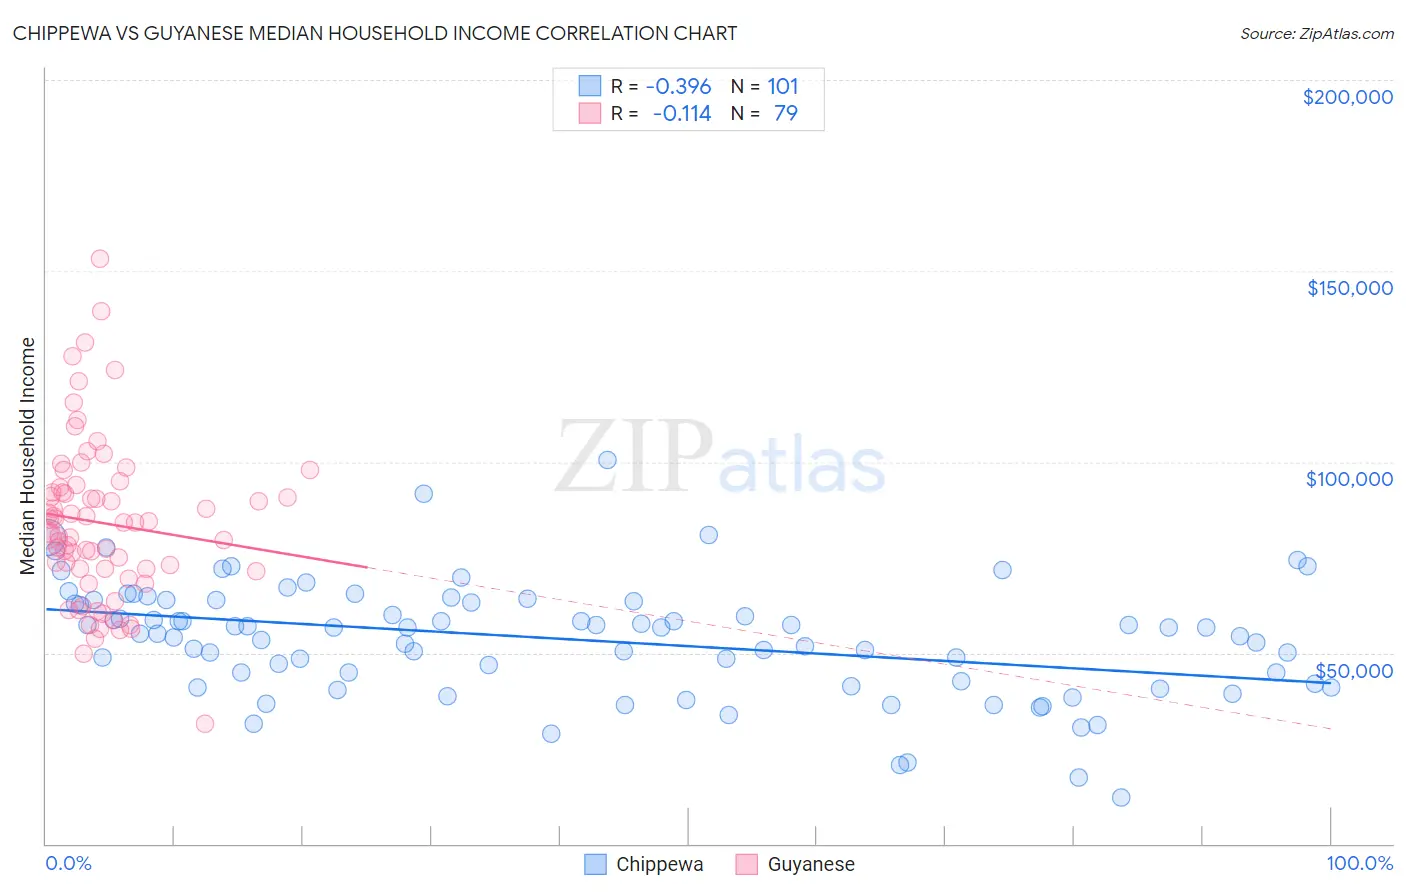
Chippewa vs Guyanese Median Household Income Correlation Chart
The statistical analysis conducted on geographies consisting of 214,988,479 people shows a mild negative correlation between the proportion of Chippewa and median household income in the United States with a correlation coefficient (R) of -0.396 and weighted average of $70,539. Similarly, the statistical analysis conducted on geographies consisting of 176,770,411 people shows a poor negative correlation between the proportion of Guyanese and median household income in the United States with a correlation coefficient (R) of -0.114 and weighted average of $80,734, a difference of 14.4%.
Median Household Income Correlation Summary
| Measurement | Chippewa | Guyanese |
| Minimum | $12,000 | $31,571 |
| Maximum | $100,625 | $153,152 |
| Range | $88,625 | $121,581 |
| Mean | $53,554 | $83,976 |
| Median | $56,473 | $84,085 |
| Interquartile 25% (IQ1) | $42,264 | $71,864 |
| Interquartile 75% (IQ3) | $63,716 | $93,235 |
| Interquartile Range (IQR) | $21,452 | $21,371 |
| Standard Deviation (Sample) | $15,182 | $21,109 |
| Standard Deviation (Population) | $15,107 | $20,975 |
Similar Demographics by Median Household Income
Demographics Similar to Chippewa by Median Household Income
In terms of median household income, the demographic groups most similar to Chippewa are Cajun ($70,605, a difference of 0.090%), Immigrants from Dominican Republic ($70,208, a difference of 0.47%), Apache ($70,927, a difference of 0.55%), Ottawa ($70,984, a difference of 0.63%), and Colville ($70,094, a difference of 0.63%).
| Demographics | Rating | Rank | Median Household Income |
| Immigrants | Zaire | 0.0 /100 | #311 | Tragic $71,801 |
| Immigrants | Honduras | 0.0 /100 | #312 | Tragic $71,452 |
| Immigrants | Bahamas | 0.0 /100 | #313 | Tragic $71,349 |
| Dominicans | 0.0 /100 | #314 | Tragic $71,302 |
| Ottawa | 0.0 /100 | #315 | Tragic $70,984 |
| Apache | 0.0 /100 | #316 | Tragic $70,927 |
| Cajuns | 0.0 /100 | #317 | Tragic $70,605 |
| Chippewa | 0.0 /100 | #318 | Tragic $70,539 |
| Immigrants | Dominican Republic | 0.0 /100 | #319 | Tragic $70,208 |
| Colville | 0.0 /100 | #320 | Tragic $70,094 |
| Chickasaw | 0.0 /100 | #321 | Tragic $70,005 |
| Choctaw | 0.0 /100 | #322 | Tragic $69,947 |
| Bahamians | 0.0 /100 | #323 | Tragic $69,726 |
| Yup'ik | 0.0 /100 | #324 | Tragic $69,695 |
| Seminole | 0.0 /100 | #325 | Tragic $69,420 |
Demographics Similar to Guyanese by Median Household Income
In terms of median household income, the demographic groups most similar to Guyanese are Immigrants from Bangladesh ($80,722, a difference of 0.010%), Immigrants from Panama ($80,873, a difference of 0.17%), Delaware ($80,527, a difference of 0.26%), Scotch-Irish ($80,972, a difference of 0.29%), and Malaysian ($81,064, a difference of 0.41%).
| Demographics | Rating | Rank | Median Household Income |
| Immigrants | Venezuela | 9.0 /100 | #220 | Tragic $81,506 |
| Immigrants | Ghana | 9.0 /100 | #221 | Tragic $81,489 |
| Immigrants | Nigeria | 7.7 /100 | #222 | Tragic $81,236 |
| Immigrants | El Salvador | 7.6 /100 | #223 | Tragic $81,213 |
| Malaysians | 7.0 /100 | #224 | Tragic $81,064 |
| Scotch-Irish | 6.6 /100 | #225 | Tragic $80,972 |
| Immigrants | Panama | 6.2 /100 | #226 | Tragic $80,873 |
| Guyanese | 5.7 /100 | #227 | Tragic $80,734 |
| Immigrants | Bangladesh | 5.7 /100 | #228 | Tragic $80,722 |
| Delaware | 5.0 /100 | #229 | Tragic $80,527 |
| Bermudans | 4.7 /100 | #230 | Tragic $80,406 |
| Trinidadians and Tobagonians | 4.7 /100 | #231 | Tragic $80,402 |
| Immigrants | Trinidad and Tobago | 4.6 /100 | #232 | Tragic $80,373 |
| Immigrants | Azores | 4.5 /100 | #233 | Tragic $80,357 |
| Immigrants | Ecuador | 4.5 /100 | #234 | Tragic $80,341 |