Finnish vs Immigrants from Africa Median Household Income
COMPARE
Finnish
Immigrants from Africa
Median Household Income
Median Household Income Comparison
Finns
Immigrants from Africa
$83,607
MEDIAN HOUSEHOLD INCOME
27.7/ 100
METRIC RATING
193rd/ 347
METRIC RANK
$83,289
MEDIAN HOUSEHOLD INCOME
23.8/ 100
METRIC RATING
204th/ 347
METRIC RANK
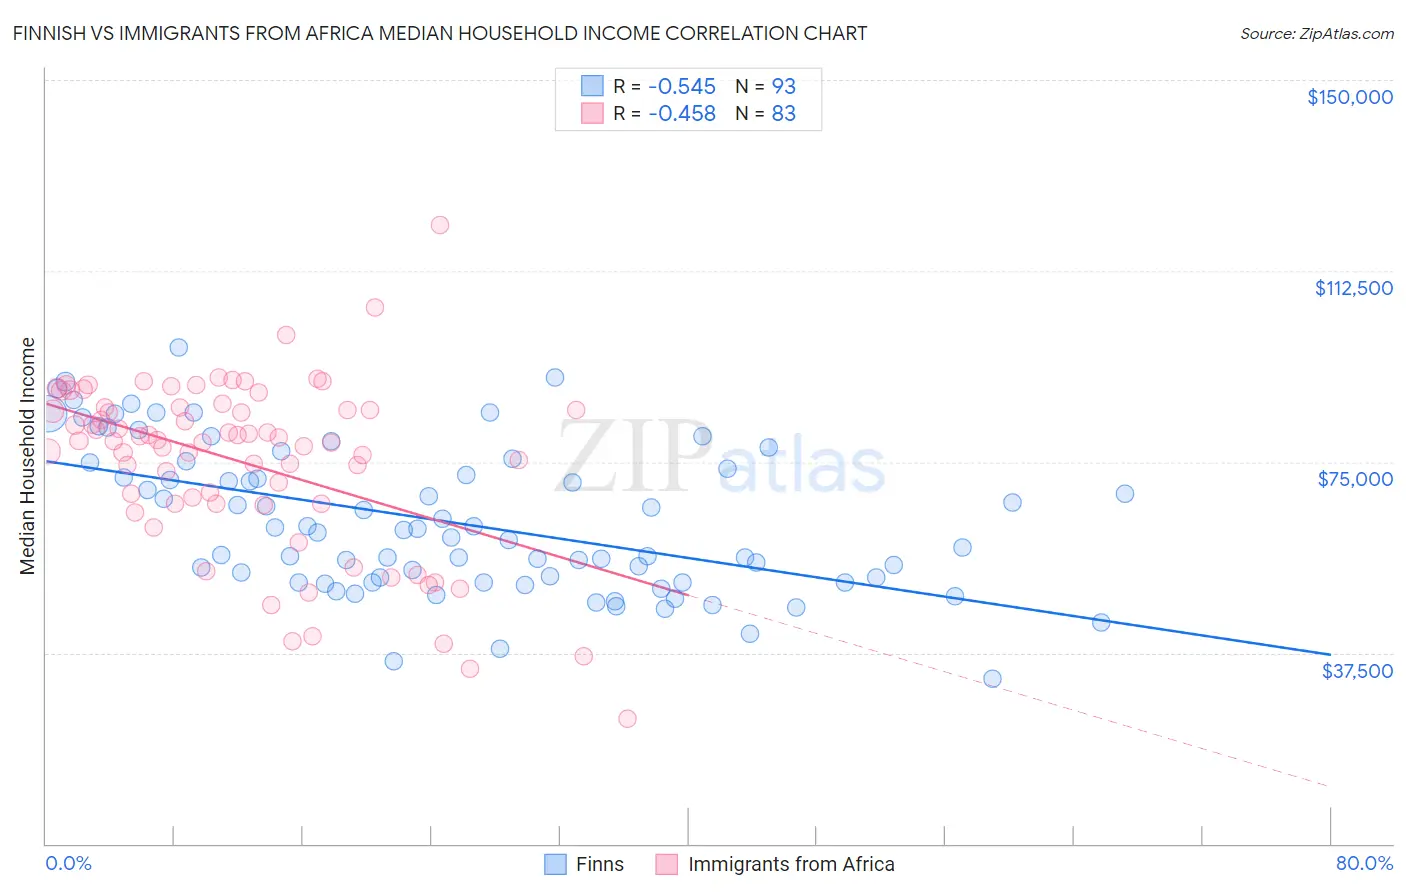
Finnish vs Immigrants from Africa Median Household Income Correlation Chart
The statistical analysis conducted on geographies consisting of 404,464,617 people shows a substantial negative correlation between the proportion of Finns and median household income in the United States with a correlation coefficient (R) of -0.545 and weighted average of $83,607. Similarly, the statistical analysis conducted on geographies consisting of 468,807,581 people shows a moderate negative correlation between the proportion of Immigrants from Africa and median household income in the United States with a correlation coefficient (R) of -0.458 and weighted average of $83,289, a difference of 0.38%.
Median Household Income Correlation Summary
| Measurement | Finnish | Immigrants from Africa |
| Minimum | $32,321 | $24,660 |
| Maximum | $97,373 | $121,421 |
| Range | $65,052 | $96,761 |
| Mean | $63,204 | $74,867 |
| Median | $61,019 | $79,143 |
| Interquartile 25% (IQ1) | $51,350 | $66,824 |
| Interquartile 75% (IQ3) | $74,285 | $85,728 |
| Interquartile Range (IQR) | $22,935 | $18,904 |
| Standard Deviation (Sample) | $14,392 | $17,152 |
| Standard Deviation (Population) | $14,315 | $17,048 |
Demographics Similar to Finns and Immigrants from Africa by Median Household Income
In terms of median household income, the demographic groups most similar to Finns are Welsh ($83,628, a difference of 0.030%), Ghanaian ($83,582, a difference of 0.030%), Immigrants from Armenia ($83,555, a difference of 0.060%), French ($83,468, a difference of 0.17%), and Iraqi ($83,753, a difference of 0.18%). Similarly, the demographic groups most similar to Immigrants from Africa are Immigrants from Cambodia ($83,304, a difference of 0.020%), Immigrants from Thailand ($83,327, a difference of 0.050%), Tsimshian ($83,346, a difference of 0.070%), Spanish ($83,343, a difference of 0.070%), and German ($83,358, a difference of 0.080%).
| Demographics | Rating | Rank | Median Household Income |
| Tlingit-Haida | 32.6 /100 | #188 | Fair $83,968 |
| Immigrants | Colombia | 31.7 /100 | #189 | Fair $83,902 |
| Slovaks | 30.2 /100 | #190 | Fair $83,798 |
| Iraqis | 29.6 /100 | #191 | Fair $83,753 |
| Welsh | 28.0 /100 | #192 | Fair $83,628 |
| Finns | 27.7 /100 | #193 | Fair $83,607 |
| Ghanaians | 27.4 /100 | #194 | Fair $83,582 |
| Immigrants | Armenia | 27.0 /100 | #195 | Fair $83,555 |
| French | 26.0 /100 | #196 | Fair $83,468 |
| Aleuts | 25.7 /100 | #197 | Fair $83,446 |
| Japanese | 25.1 /100 | #198 | Fair $83,395 |
| Germans | 24.6 /100 | #199 | Fair $83,358 |
| Tsimshian | 24.5 /100 | #200 | Fair $83,346 |
| Spanish | 24.4 /100 | #201 | Fair $83,343 |
| Immigrants | Thailand | 24.3 /100 | #202 | Fair $83,327 |
| Immigrants | Cambodia | 24.0 /100 | #203 | Fair $83,304 |
| Immigrants | Africa | 23.8 /100 | #204 | Fair $83,289 |
| Celtics | 22.7 /100 | #205 | Fair $83,193 |
| Immigrants | Kenya | 21.3 /100 | #206 | Fair $83,068 |
| Dutch | 20.3 /100 | #207 | Fair $82,971 |
| French Canadians | 18.7 /100 | #208 | Poor $82,810 |