Chinese vs Bangladeshi Median Male Earnings
COMPARE
Chinese
Bangladeshi
Median Male Earnings
Median Male Earnings Comparison
Chinese
Bangladeshis
$56,872
MEDIAN MALE EARNINGS
91.1/ 100
METRIC RATING
126th/ 347
METRIC RANK
$46,744
MEDIAN MALE EARNINGS
0.1/ 100
METRIC RATING
304th/ 347
METRIC RANK
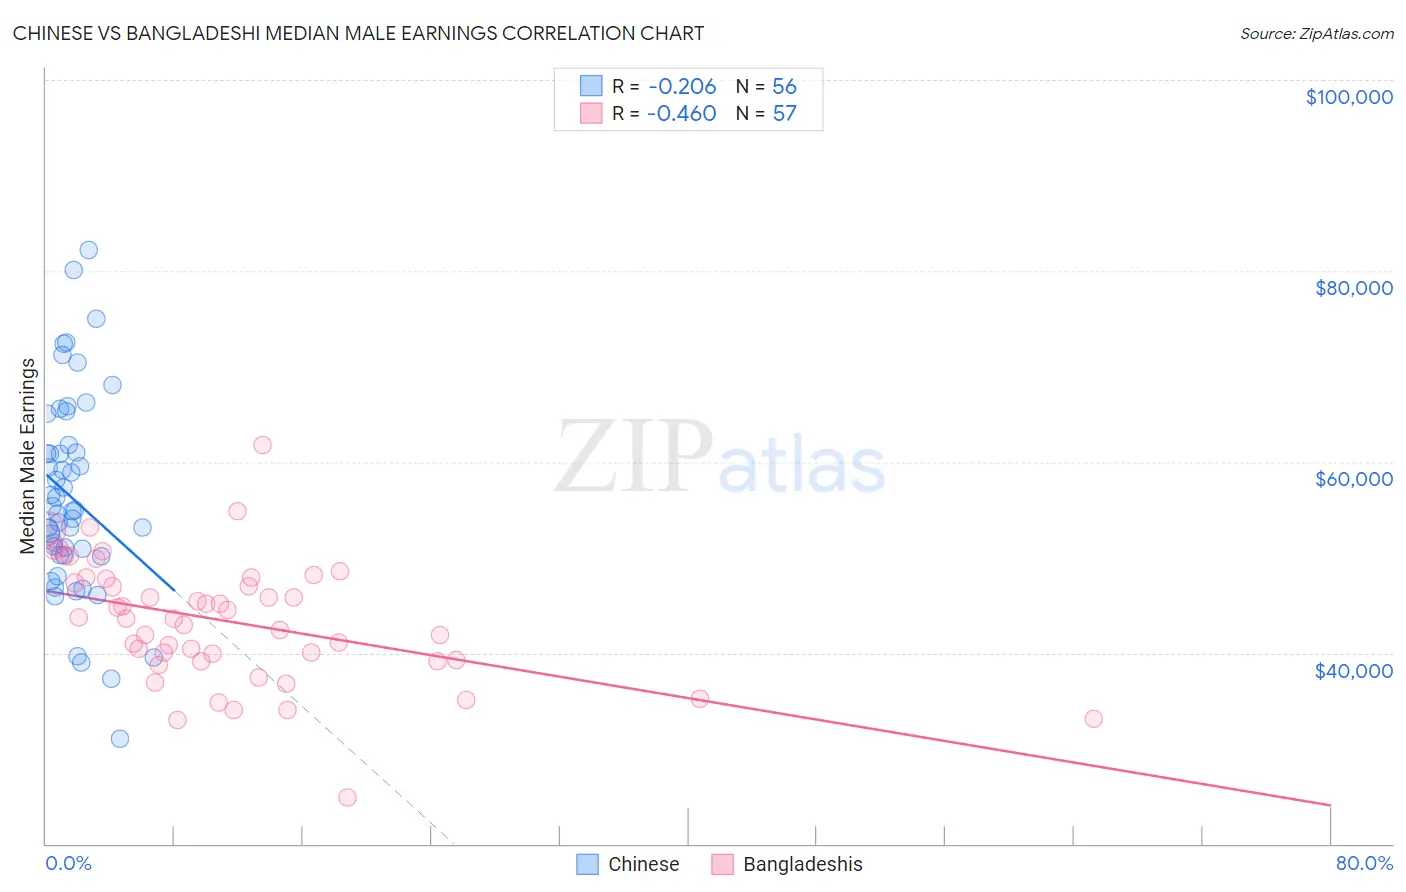
Chinese vs Bangladeshi Median Male Earnings Correlation Chart
The statistical analysis conducted on geographies consisting of 64,807,348 people shows a weak negative correlation between the proportion of Chinese and median male earnings in the United States with a correlation coefficient (R) of -0.206 and weighted average of $56,872. Similarly, the statistical analysis conducted on geographies consisting of 141,442,222 people shows a moderate negative correlation between the proportion of Bangladeshis and median male earnings in the United States with a correlation coefficient (R) of -0.460 and weighted average of $46,744, a difference of 21.7%.
Median Male Earnings Correlation Summary
| Measurement | Chinese | Bangladeshi |
| Minimum | $31,000 | $24,888 |
| Maximum | $82,197 | $61,776 |
| Range | $51,197 | $36,888 |
| Mean | $56,277 | $43,307 |
| Median | $54,905 | $43,611 |
| Interquartile 25% (IQ1) | $50,221 | $39,220 |
| Interquartile 75% (IQ3) | $61,384 | $47,786 |
| Interquartile Range (IQR) | $11,163 | $8,565 |
| Standard Deviation (Sample) | $10,489 | $6,481 |
| Standard Deviation (Population) | $10,395 | $6,424 |
Similar Demographics by Median Male Earnings
Demographics Similar to Chinese by Median Male Earnings
In terms of median male earnings, the demographic groups most similar to Chinese are Brazilian ($56,837, a difference of 0.060%), Immigrants from Syria ($56,830, a difference of 0.070%), Immigrants from Morocco ($56,958, a difference of 0.15%), Chilean ($56,973, a difference of 0.18%), and Pakistani ($56,719, a difference of 0.27%).
| Demographics | Rating | Rank | Median Male Earnings |
| Arabs | 94.0 /100 | #119 | Exceptional $57,298 |
| Canadians | 93.9 /100 | #120 | Exceptional $57,286 |
| Immigrants | Albania | 93.3 /100 | #121 | Exceptional $57,179 |
| Immigrants | Jordan | 93.1 /100 | #122 | Exceptional $57,145 |
| Slovenes | 93.1 /100 | #123 | Exceptional $57,145 |
| Chileans | 91.9 /100 | #124 | Exceptional $56,973 |
| Immigrants | Morocco | 91.8 /100 | #125 | Exceptional $56,958 |
| Chinese | 91.1 /100 | #126 | Exceptional $56,872 |
| Brazilians | 90.9 /100 | #127 | Exceptional $56,837 |
| Immigrants | Syria | 90.8 /100 | #128 | Exceptional $56,830 |
| Pakistanis | 89.9 /100 | #129 | Excellent $56,719 |
| Koreans | 89.4 /100 | #130 | Excellent $56,672 |
| Portuguese | 89.4 /100 | #131 | Excellent $56,663 |
| Czechs | 88.2 /100 | #132 | Excellent $56,546 |
| Immigrants | Germany | 88.2 /100 | #133 | Excellent $56,542 |
Demographics Similar to Bangladeshis by Median Male Earnings
In terms of median male earnings, the demographic groups most similar to Bangladeshis are Guatemalan ($46,736, a difference of 0.020%), Yaqui ($46,777, a difference of 0.070%), Seminole ($46,783, a difference of 0.080%), Dutch West Indian ($46,656, a difference of 0.19%), and Immigrants from Dominican Republic ($46,655, a difference of 0.19%).
| Demographics | Rating | Rank | Median Male Earnings |
| Dominicans | 0.1 /100 | #297 | Tragic $47,204 |
| Immigrants | Micronesia | 0.1 /100 | #298 | Tragic $47,177 |
| Immigrants | Zaire | 0.1 /100 | #299 | Tragic $47,070 |
| U.S. Virgin Islanders | 0.1 /100 | #300 | Tragic $47,066 |
| Immigrants | Latin America | 0.1 /100 | #301 | Tragic $46,941 |
| Seminole | 0.1 /100 | #302 | Tragic $46,783 |
| Yaqui | 0.1 /100 | #303 | Tragic $46,777 |
| Bangladeshis | 0.1 /100 | #304 | Tragic $46,744 |
| Guatemalans | 0.0 /100 | #305 | Tragic $46,736 |
| Dutch West Indians | 0.0 /100 | #306 | Tragic $46,656 |
| Immigrants | Dominican Republic | 0.0 /100 | #307 | Tragic $46,655 |
| Ottawa | 0.0 /100 | #308 | Tragic $46,611 |
| Creek | 0.0 /100 | #309 | Tragic $46,594 |
| Cubans | 0.0 /100 | #310 | Tragic $46,580 |
| Apache | 0.0 /100 | #311 | Tragic $46,429 |