Immigrants from Eastern Europe vs Chilean Median Female Earnings
COMPARE
Immigrants from Eastern Europe
Chilean
Median Female Earnings
Median Female Earnings Comparison
Immigrants from Eastern Europe
Chileans
$43,309
MEDIAN FEMALE EARNINGS
99.9/ 100
METRIC RATING
53rd/ 347
METRIC RANK
$40,757
MEDIAN FEMALE EARNINGS
90.0/ 100
METRIC RATING
131st/ 347
METRIC RANK
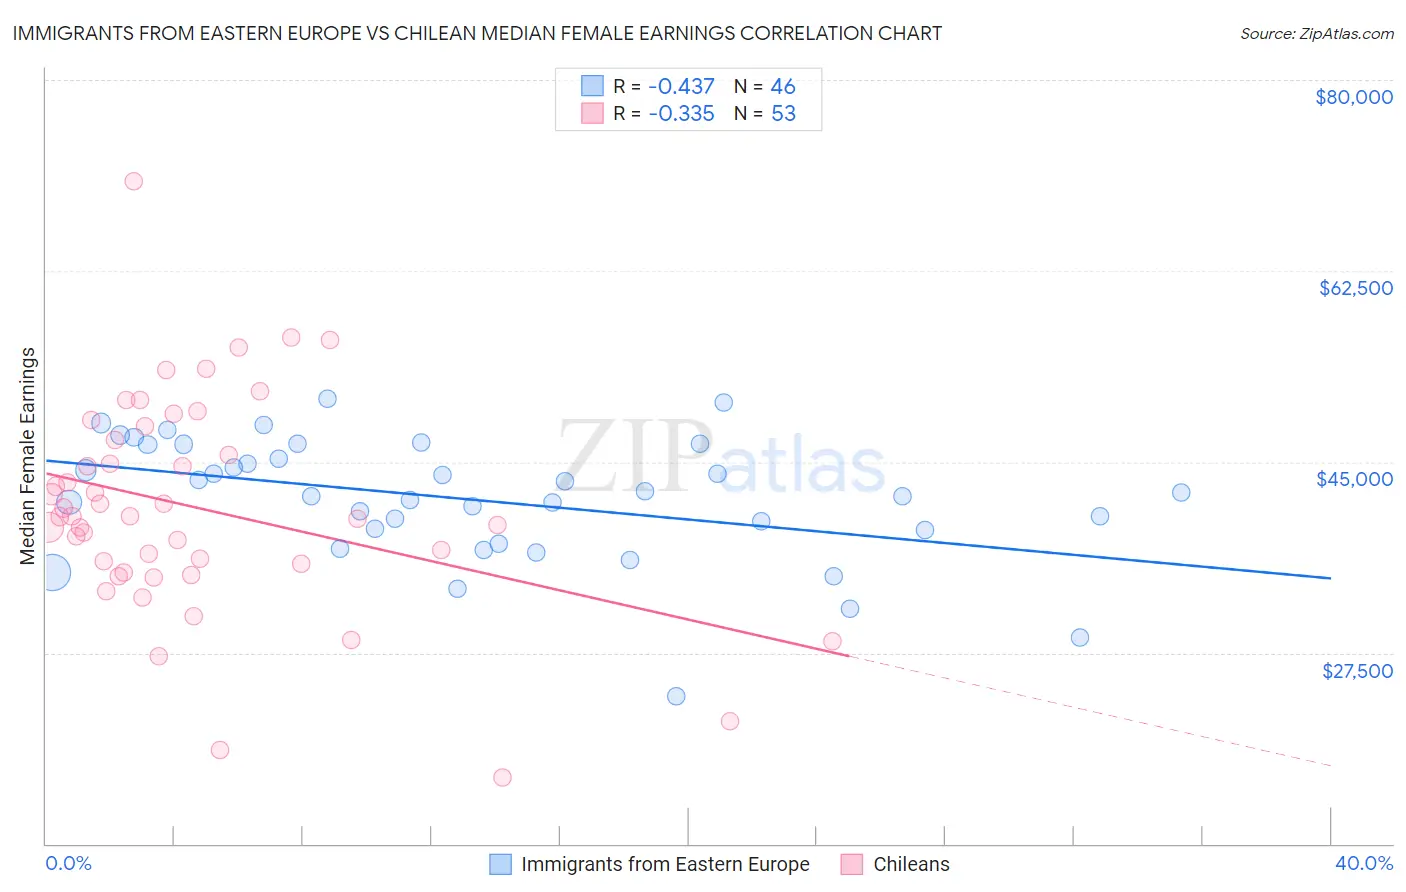
Immigrants from Eastern Europe vs Chilean Median Female Earnings Correlation Chart
The statistical analysis conducted on geographies consisting of 475,519,051 people shows a moderate negative correlation between the proportion of Immigrants from Eastern Europe and median female earnings in the United States with a correlation coefficient (R) of -0.437 and weighted average of $43,309. Similarly, the statistical analysis conducted on geographies consisting of 256,655,155 people shows a mild negative correlation between the proportion of Chileans and median female earnings in the United States with a correlation coefficient (R) of -0.335 and weighted average of $40,757, a difference of 6.3%.
Median Female Earnings Correlation Summary
| Measurement | Immigrants from Eastern Europe | Chilean |
| Minimum | $23,547 | $16,042 |
| Maximum | $50,763 | $70,707 |
| Range | $27,216 | $54,665 |
| Mean | $41,579 | $40,800 |
| Median | $41,989 | $39,990 |
| Interquartile 25% (IQ1) | $38,750 | $35,267 |
| Interquartile 75% (IQ3) | $46,583 | $47,653 |
| Interquartile Range (IQR) | $7,833 | $12,386 |
| Standard Deviation (Sample) | $5,669 | $9,907 |
| Standard Deviation (Population) | $5,607 | $9,813 |
Similar Demographics by Median Female Earnings
Demographics Similar to Immigrants from Eastern Europe by Median Female Earnings
In terms of median female earnings, the demographic groups most similar to Immigrants from Eastern Europe are Australian ($43,308, a difference of 0.0%), Egyptian ($43,305, a difference of 0.010%), Immigrants from Lithuania ($43,317, a difference of 0.020%), Maltese ($43,357, a difference of 0.11%), and Immigrants from Uzbekistan ($43,363, a difference of 0.12%).
| Demographics | Rating | Rank | Median Female Earnings |
| Immigrants | Bolivia | 100.0 /100 | #46 | Exceptional $43,467 |
| Bolivians | 100.0 /100 | #47 | Exceptional $43,445 |
| Immigrants | Indonesia | 100.0 /100 | #48 | Exceptional $43,412 |
| Immigrants | Serbia | 100.0 /100 | #49 | Exceptional $43,385 |
| Immigrants | Uzbekistan | 100.0 /100 | #50 | Exceptional $43,363 |
| Maltese | 100.0 /100 | #51 | Exceptional $43,357 |
| Immigrants | Lithuania | 99.9 /100 | #52 | Exceptional $43,317 |
| Immigrants | Eastern Europe | 99.9 /100 | #53 | Exceptional $43,309 |
| Australians | 99.9 /100 | #54 | Exceptional $43,308 |
| Egyptians | 99.9 /100 | #55 | Exceptional $43,305 |
| Immigrants | Croatia | 99.9 /100 | #56 | Exceptional $43,258 |
| Ethiopians | 99.9 /100 | #57 | Exceptional $43,243 |
| Paraguayans | 99.9 /100 | #58 | Exceptional $43,173 |
| Estonians | 99.9 /100 | #59 | Exceptional $43,106 |
| Immigrants | Latvia | 99.9 /100 | #60 | Exceptional $43,099 |
Demographics Similar to Chileans by Median Female Earnings
In terms of median female earnings, the demographic groups most similar to Chileans are Immigrants from Guyana ($40,773, a difference of 0.040%), Immigrants from Uganda ($40,739, a difference of 0.040%), Syrian ($40,727, a difference of 0.070%), Zimbabwean ($40,798, a difference of 0.10%), and Arab ($40,718, a difference of 0.10%).
| Demographics | Rating | Rank | Median Female Earnings |
| Trinidadians and Tobagonians | 93.2 /100 | #124 | Exceptional $40,958 |
| Austrians | 92.7 /100 | #125 | Exceptional $40,923 |
| Immigrants | Trinidad and Tobago | 92.3 /100 | #126 | Exceptional $40,895 |
| Ugandans | 92.2 /100 | #127 | Exceptional $40,889 |
| Carpatho Rusyns | 91.2 /100 | #128 | Exceptional $40,825 |
| Zimbabweans | 90.8 /100 | #129 | Exceptional $40,798 |
| Immigrants | Guyana | 90.3 /100 | #130 | Exceptional $40,773 |
| Chileans | 90.0 /100 | #131 | Exceptional $40,757 |
| Immigrants | Uganda | 89.7 /100 | #132 | Excellent $40,739 |
| Syrians | 89.5 /100 | #133 | Excellent $40,727 |
| Arabs | 89.3 /100 | #134 | Excellent $40,718 |
| Immigrants | Nepal | 89.0 /100 | #135 | Excellent $40,704 |
| Immigrants | Eastern Africa | 87.7 /100 | #136 | Excellent $40,644 |
| Pakistanis | 86.6 /100 | #137 | Excellent $40,596 |
| Taiwanese | 86.1 /100 | #138 | Excellent $40,576 |