Ottawa vs Chilean Median Female Earnings
COMPARE
Ottawa
Chilean
Median Female Earnings
Median Female Earnings Comparison
Ottawa
Chileans
$33,378
MEDIAN FEMALE EARNINGS
0.0/ 100
METRIC RATING
336th/ 347
METRIC RANK
$40,757
MEDIAN FEMALE EARNINGS
90.0/ 100
METRIC RATING
131st/ 347
METRIC RANK
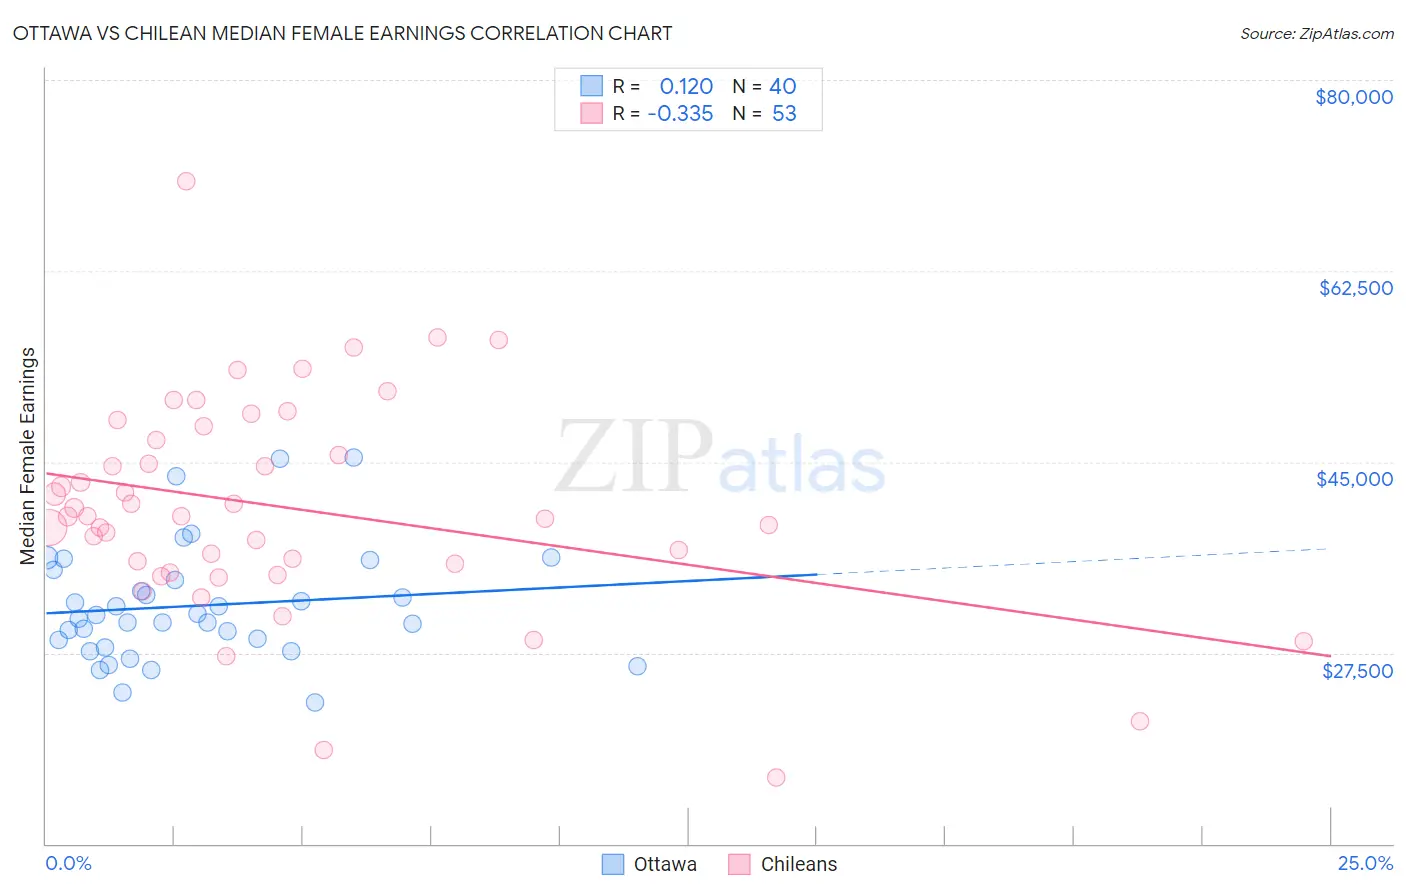
Ottawa vs Chilean Median Female Earnings Correlation Chart
The statistical analysis conducted on geographies consisting of 49,946,188 people shows a poor positive correlation between the proportion of Ottawa and median female earnings in the United States with a correlation coefficient (R) of 0.120 and weighted average of $33,378. Similarly, the statistical analysis conducted on geographies consisting of 256,655,155 people shows a mild negative correlation between the proportion of Chileans and median female earnings in the United States with a correlation coefficient (R) of -0.335 and weighted average of $40,757, a difference of 22.1%.
Median Female Earnings Correlation Summary
| Measurement | Ottawa | Chilean |
| Minimum | $22,891 | $16,042 |
| Maximum | $45,375 | $70,707 |
| Range | $22,484 | $54,665 |
| Mean | $31,817 | $40,800 |
| Median | $30,771 | $39,990 |
| Interquartile 25% (IQ1) | $28,352 | $35,267 |
| Interquartile 75% (IQ3) | $34,654 | $47,653 |
| Interquartile Range (IQR) | $6,302 | $12,386 |
| Standard Deviation (Sample) | $5,248 | $9,907 |
| Standard Deviation (Population) | $5,182 | $9,813 |
Similar Demographics by Median Female Earnings
Demographics Similar to Ottawa by Median Female Earnings
In terms of median female earnings, the demographic groups most similar to Ottawa are Yakama ($33,354, a difference of 0.070%), Creek ($33,437, a difference of 0.18%), Immigrants from Cuba ($33,291, a difference of 0.26%), Immigrants from Mexico ($33,236, a difference of 0.43%), and Tohono O'odham ($33,205, a difference of 0.52%).
| Demographics | Rating | Rank | Median Female Earnings |
| Hopi | 0.0 /100 | #329 | Tragic $33,932 |
| Menominee | 0.0 /100 | #330 | Tragic $33,894 |
| Natives/Alaskans | 0.0 /100 | #331 | Tragic $33,806 |
| Choctaw | 0.0 /100 | #332 | Tragic $33,775 |
| Mexicans | 0.0 /100 | #333 | Tragic $33,664 |
| Spanish American Indians | 0.0 /100 | #334 | Tragic $33,625 |
| Creek | 0.0 /100 | #335 | Tragic $33,437 |
| Ottawa | 0.0 /100 | #336 | Tragic $33,378 |
| Yakama | 0.0 /100 | #337 | Tragic $33,354 |
| Immigrants | Cuba | 0.0 /100 | #338 | Tragic $33,291 |
| Immigrants | Mexico | 0.0 /100 | #339 | Tragic $33,236 |
| Tohono O'odham | 0.0 /100 | #340 | Tragic $33,205 |
| Navajo | 0.0 /100 | #341 | Tragic $33,046 |
| Yup'ik | 0.0 /100 | #342 | Tragic $32,730 |
| Pueblo | 0.0 /100 | #343 | Tragic $32,564 |
Demographics Similar to Chileans by Median Female Earnings
In terms of median female earnings, the demographic groups most similar to Chileans are Immigrants from Guyana ($40,773, a difference of 0.040%), Immigrants from Uganda ($40,739, a difference of 0.040%), Syrian ($40,727, a difference of 0.070%), Zimbabwean ($40,798, a difference of 0.10%), and Arab ($40,718, a difference of 0.10%).
| Demographics | Rating | Rank | Median Female Earnings |
| Trinidadians and Tobagonians | 93.2 /100 | #124 | Exceptional $40,958 |
| Austrians | 92.7 /100 | #125 | Exceptional $40,923 |
| Immigrants | Trinidad and Tobago | 92.3 /100 | #126 | Exceptional $40,895 |
| Ugandans | 92.2 /100 | #127 | Exceptional $40,889 |
| Carpatho Rusyns | 91.2 /100 | #128 | Exceptional $40,825 |
| Zimbabweans | 90.8 /100 | #129 | Exceptional $40,798 |
| Immigrants | Guyana | 90.3 /100 | #130 | Exceptional $40,773 |
| Chileans | 90.0 /100 | #131 | Exceptional $40,757 |
| Immigrants | Uganda | 89.7 /100 | #132 | Excellent $40,739 |
| Syrians | 89.5 /100 | #133 | Excellent $40,727 |
| Arabs | 89.3 /100 | #134 | Excellent $40,718 |
| Immigrants | Nepal | 89.0 /100 | #135 | Excellent $40,704 |
| Immigrants | Eastern Africa | 87.7 /100 | #136 | Excellent $40,644 |
| Pakistanis | 86.6 /100 | #137 | Excellent $40,596 |
| Taiwanese | 86.1 /100 | #138 | Excellent $40,576 |