Immigrants from Chile vs Chilean Median Female Earnings
COMPARE
Immigrants from Chile
Chilean
Median Female Earnings
Median Female Earnings Comparison
Immigrants from Chile
Chileans
$40,353
MEDIAN FEMALE EARNINGS
79.6/ 100
METRIC RATING
150th/ 347
METRIC RANK
$40,757
MEDIAN FEMALE EARNINGS
90.0/ 100
METRIC RATING
131st/ 347
METRIC RANK
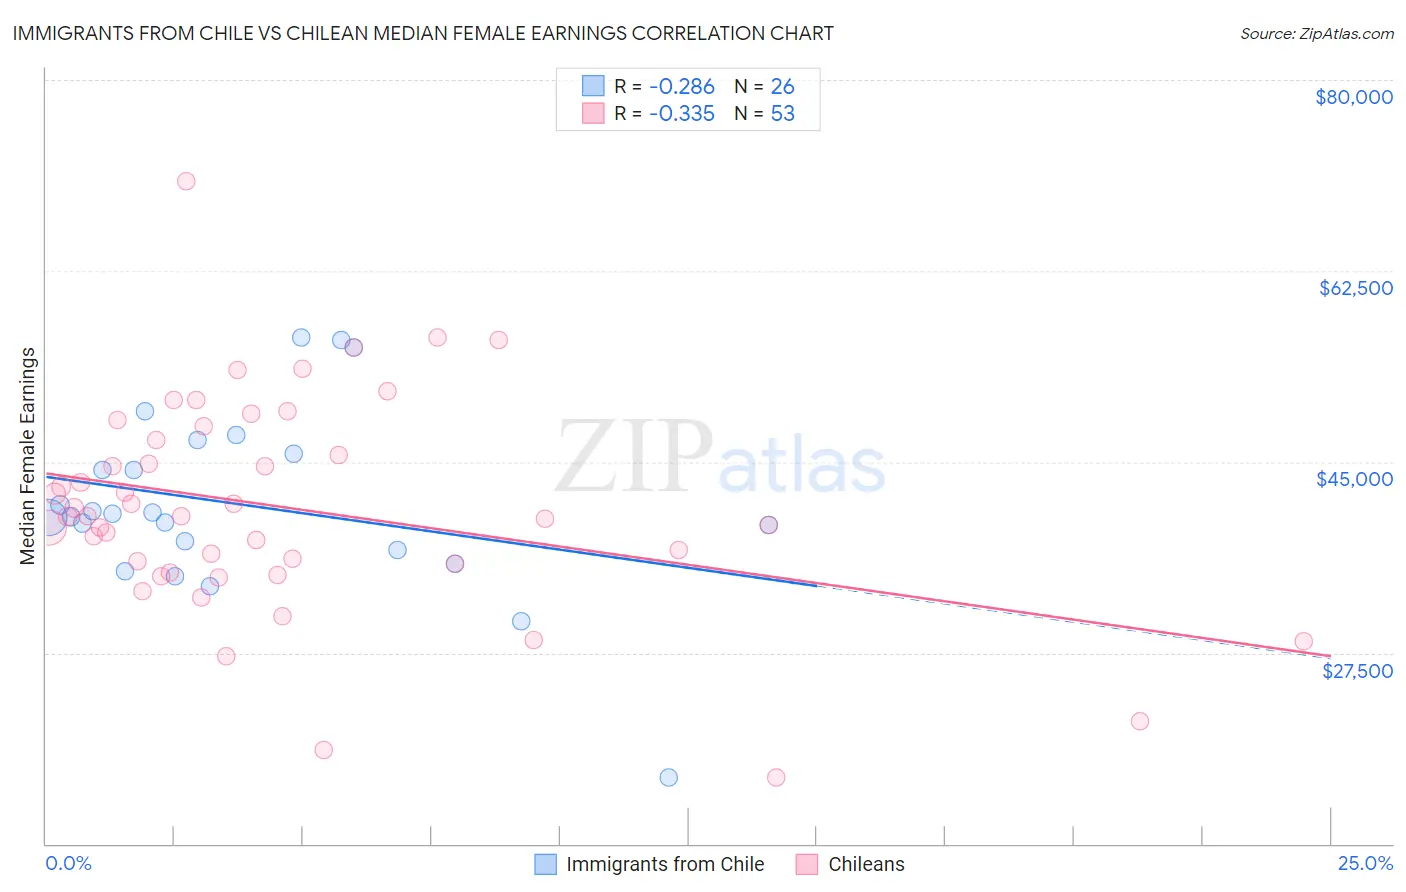
Immigrants from Chile vs Chilean Median Female Earnings Correlation Chart
The statistical analysis conducted on geographies consisting of 218,612,520 people shows a weak negative correlation between the proportion of Immigrants from Chile and median female earnings in the United States with a correlation coefficient (R) of -0.286 and weighted average of $40,353. Similarly, the statistical analysis conducted on geographies consisting of 256,655,155 people shows a mild negative correlation between the proportion of Chileans and median female earnings in the United States with a correlation coefficient (R) of -0.335 and weighted average of $40,757, a difference of 1.0%.
Median Female Earnings Correlation Summary
| Measurement | Immigrants from Chile | Chilean |
| Minimum | $16,042 | $16,042 |
| Maximum | $56,442 | $70,707 |
| Range | $40,400 | $54,665 |
| Mean | $41,031 | $40,800 |
| Median | $40,109 | $39,990 |
| Interquartile 25% (IQ1) | $36,875 | $35,267 |
| Interquartile 75% (IQ3) | $45,789 | $47,653 |
| Interquartile Range (IQR) | $8,914 | $12,386 |
| Standard Deviation (Sample) | $8,520 | $9,907 |
| Standard Deviation (Population) | $8,355 | $9,813 |
Demographics Similar to Immigrants from Chile and Chileans by Median Female Earnings
In terms of median female earnings, the demographic groups most similar to Immigrants from Chile are Immigrants from Cameroon ($40,354, a difference of 0.0%), Polish ($40,371, a difference of 0.040%), Vietnamese ($40,377, a difference of 0.060%), Ghanaian ($40,429, a difference of 0.19%), and Brazilian ($40,483, a difference of 0.32%). Similarly, the demographic groups most similar to Chileans are Immigrants from Guyana ($40,773, a difference of 0.040%), Immigrants from Uganda ($40,739, a difference of 0.040%), Syrian ($40,727, a difference of 0.070%), Arab ($40,718, a difference of 0.10%), and Immigrants from Nepal ($40,704, a difference of 0.13%).
| Demographics | Rating | Rank | Median Female Earnings |
| Immigrants | Guyana | 90.3 /100 | #130 | Exceptional $40,773 |
| Chileans | 90.0 /100 | #131 | Exceptional $40,757 |
| Immigrants | Uganda | 89.7 /100 | #132 | Excellent $40,739 |
| Syrians | 89.5 /100 | #133 | Excellent $40,727 |
| Arabs | 89.3 /100 | #134 | Excellent $40,718 |
| Immigrants | Nepal | 89.0 /100 | #135 | Excellent $40,704 |
| Immigrants | Eastern Africa | 87.7 /100 | #136 | Excellent $40,644 |
| Pakistanis | 86.6 /100 | #137 | Excellent $40,596 |
| Taiwanese | 86.1 /100 | #138 | Excellent $40,576 |
| Immigrants | South Eastern Asia | 85.7 /100 | #139 | Excellent $40,558 |
| Serbians | 85.2 /100 | #140 | Excellent $40,539 |
| Immigrants | Syria | 84.1 /100 | #141 | Excellent $40,499 |
| Sri Lankans | 84.0 /100 | #142 | Excellent $40,496 |
| Northern Europeans | 83.9 /100 | #143 | Excellent $40,491 |
| Immigrants | North Macedonia | 83.8 /100 | #144 | Excellent $40,488 |
| Brazilians | 83.6 /100 | #145 | Excellent $40,483 |
| Ghanaians | 82.1 /100 | #146 | Excellent $40,429 |
| Vietnamese | 80.4 /100 | #147 | Excellent $40,377 |
| Poles | 80.2 /100 | #148 | Excellent $40,371 |
| Immigrants | Cameroon | 79.7 /100 | #149 | Good $40,354 |
| Immigrants | Chile | 79.6 /100 | #150 | Good $40,353 |