Immigrants from Southern Europe vs Cajun Median Female Earnings
COMPARE
Immigrants from Southern Europe
Cajun
Median Female Earnings
Median Female Earnings Comparison
Immigrants from Southern Europe
Cajuns
$42,275
MEDIAN FEMALE EARNINGS
99.5/ 100
METRIC RATING
81st/ 347
METRIC RANK
$34,034
MEDIAN FEMALE EARNINGS
0.0/ 100
METRIC RATING
327th/ 347
METRIC RANK
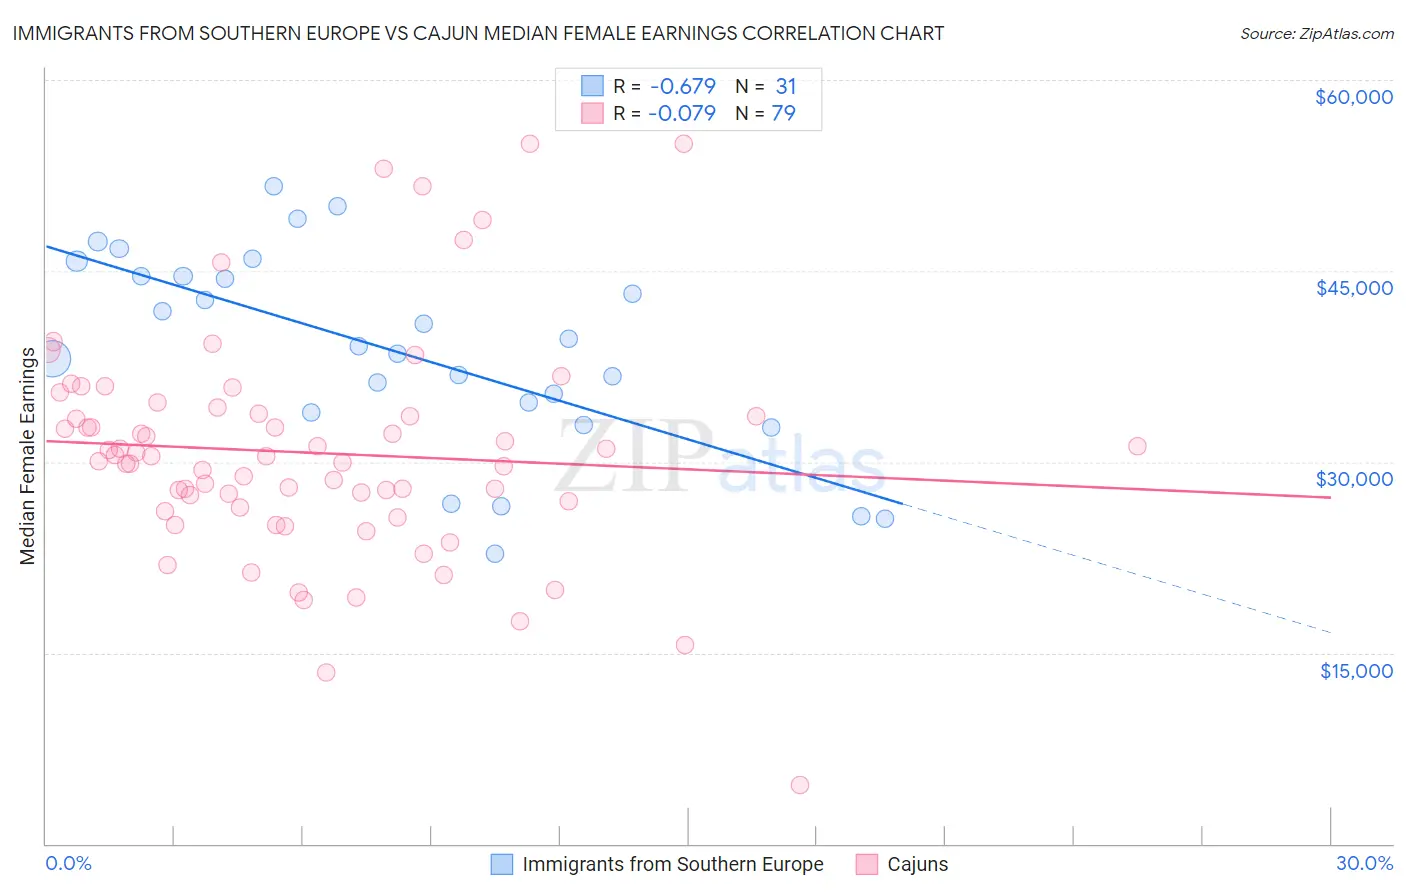
Immigrants from Southern Europe vs Cajun Median Female Earnings Correlation Chart
The statistical analysis conducted on geographies consisting of 402,600,797 people shows a significant negative correlation between the proportion of Immigrants from Southern Europe and median female earnings in the United States with a correlation coefficient (R) of -0.679 and weighted average of $42,275. Similarly, the statistical analysis conducted on geographies consisting of 149,646,456 people shows a slight negative correlation between the proportion of Cajuns and median female earnings in the United States with a correlation coefficient (R) of -0.079 and weighted average of $34,034, a difference of 24.2%.
Median Female Earnings Correlation Summary
| Measurement | Immigrants from Southern Europe | Cajun |
| Minimum | $22,783 | $4,615 |
| Maximum | $51,661 | $55,000 |
| Range | $28,878 | $50,385 |
| Mean | $38,726 | $30,723 |
| Median | $39,052 | $30,456 |
| Interquartile 25% (IQ1) | $33,886 | $26,402 |
| Interquartile 75% (IQ3) | $44,613 | $33,785 |
| Interquartile Range (IQR) | $10,727 | $7,382 |
| Standard Deviation (Sample) | $7,794 | $8,808 |
| Standard Deviation (Population) | $7,668 | $8,752 |
Similar Demographics by Median Female Earnings
Demographics Similar to Immigrants from Southern Europe by Median Female Earnings
In terms of median female earnings, the demographic groups most similar to Immigrants from Southern Europe are Immigrants from Moldova ($42,304, a difference of 0.070%), Immigrants from Morocco ($42,229, a difference of 0.11%), Immigrants from Sierra Leone ($42,214, a difference of 0.14%), Greek ($42,336, a difference of 0.15%), and Armenian ($42,212, a difference of 0.15%).
| Demographics | Rating | Rank | Median Female Earnings |
| Immigrants | South Africa | 99.7 /100 | #74 | Exceptional $42,508 |
| New Zealanders | 99.7 /100 | #75 | Exceptional $42,446 |
| Immigrants | Italy | 99.7 /100 | #76 | Exceptional $42,446 |
| Immigrants | Albania | 99.6 /100 | #77 | Exceptional $42,388 |
| Immigrants | Kazakhstan | 99.6 /100 | #78 | Exceptional $42,386 |
| Greeks | 99.6 /100 | #79 | Exceptional $42,336 |
| Immigrants | Moldova | 99.6 /100 | #80 | Exceptional $42,304 |
| Immigrants | Southern Europe | 99.5 /100 | #81 | Exceptional $42,275 |
| Immigrants | Morocco | 99.5 /100 | #82 | Exceptional $42,229 |
| Immigrants | Sierra Leone | 99.5 /100 | #83 | Exceptional $42,214 |
| Armenians | 99.5 /100 | #84 | Exceptional $42,212 |
| Laotians | 99.4 /100 | #85 | Exceptional $42,133 |
| Immigrants | St. Vincent and the Grenadines | 99.3 /100 | #86 | Exceptional $42,108 |
| Lithuanians | 99.3 /100 | #87 | Exceptional $42,108 |
| Immigrants | Northern Africa | 99.3 /100 | #88 | Exceptional $42,084 |
Demographics Similar to Cajuns by Median Female Earnings
In terms of median female earnings, the demographic groups most similar to Cajuns are Kiowa ($34,074, a difference of 0.12%), Dutch West Indian ($34,106, a difference of 0.21%), Immigrants from Central America ($33,953, a difference of 0.24%), Hopi ($33,932, a difference of 0.30%), and Menominee ($33,894, a difference of 0.41%).
| Demographics | Rating | Rank | Median Female Earnings |
| Immigrants | Honduras | 0.0 /100 | #320 | Tragic $34,647 |
| Hispanics or Latinos | 0.0 /100 | #321 | Tragic $34,421 |
| Chickasaw | 0.0 /100 | #322 | Tragic $34,414 |
| Seminole | 0.0 /100 | #323 | Tragic $34,385 |
| Immigrants | Congo | 0.0 /100 | #324 | Tragic $34,317 |
| Dutch West Indians | 0.0 /100 | #325 | Tragic $34,106 |
| Kiowa | 0.0 /100 | #326 | Tragic $34,074 |
| Cajuns | 0.0 /100 | #327 | Tragic $34,034 |
| Immigrants | Central America | 0.0 /100 | #328 | Tragic $33,953 |
| Hopi | 0.0 /100 | #329 | Tragic $33,932 |
| Menominee | 0.0 /100 | #330 | Tragic $33,894 |
| Natives/Alaskans | 0.0 /100 | #331 | Tragic $33,806 |
| Choctaw | 0.0 /100 | #332 | Tragic $33,775 |
| Mexicans | 0.0 /100 | #333 | Tragic $33,664 |
| Spanish American Indians | 0.0 /100 | #334 | Tragic $33,625 |