Chinese vs Cajun High School Diploma
COMPARE
Chinese
Cajun
High School Diploma
High School Diploma Comparison
Chinese
Cajuns
92.0%
HIGH SCHOOL DIPLOMA
100.0/ 100
METRIC RATING
8th/ 347
METRIC RANK
87.3%
HIGH SCHOOL DIPLOMA
0.4/ 100
METRIC RATING
260th/ 347
METRIC RANK
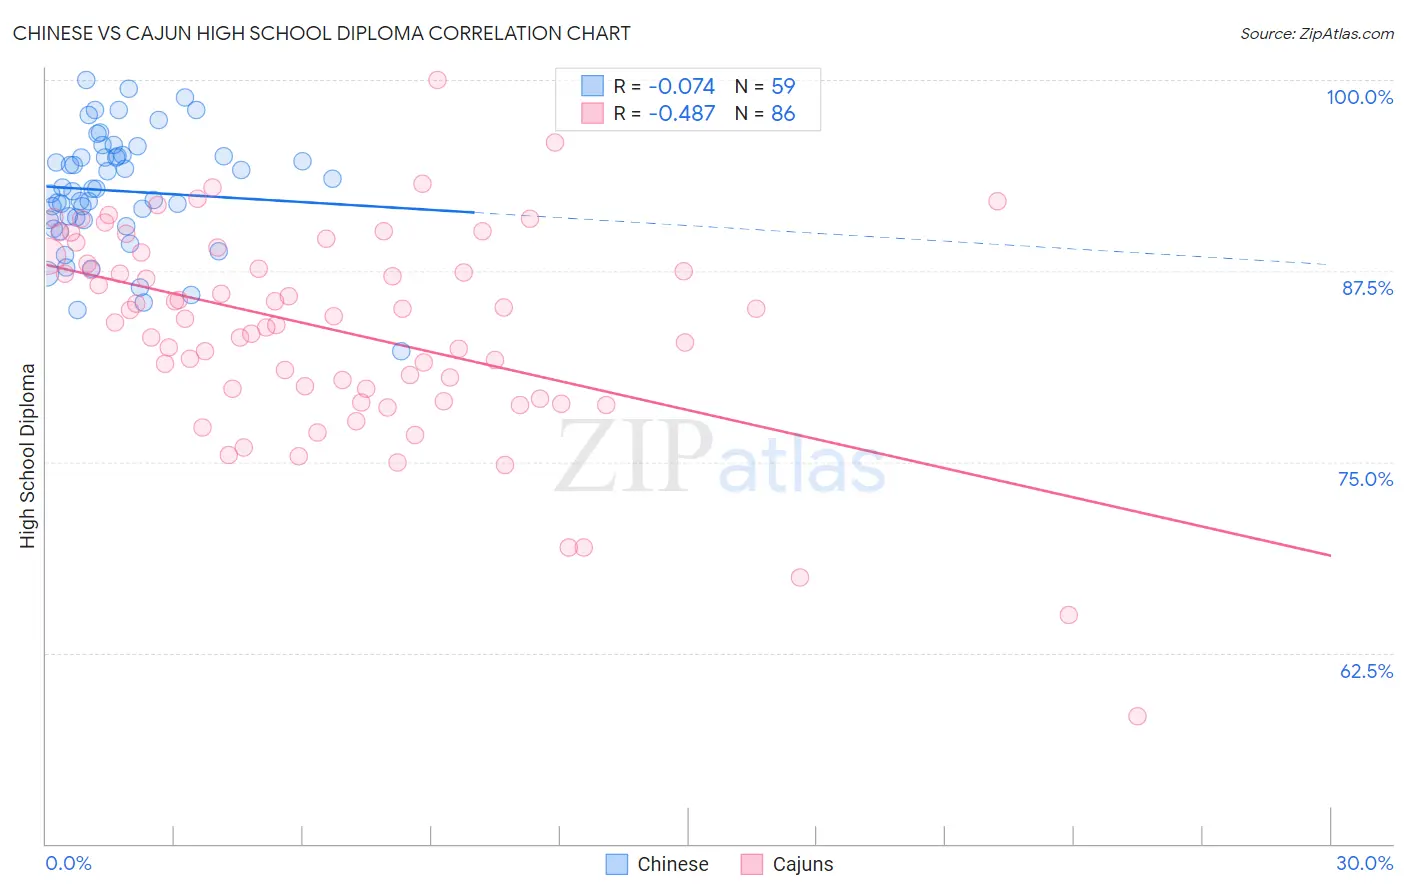
Chinese vs Cajun High School Diploma Correlation Chart
The statistical analysis conducted on geographies consisting of 64,809,883 people shows a slight negative correlation between the proportion of Chinese and percentage of population with at least high school diploma education in the United States with a correlation coefficient (R) of -0.074 and weighted average of 92.0%. Similarly, the statistical analysis conducted on geographies consisting of 149,713,149 people shows a moderate negative correlation between the proportion of Cajuns and percentage of population with at least high school diploma education in the United States with a correlation coefficient (R) of -0.487 and weighted average of 87.3%, a difference of 5.4%.
High School Diploma Correlation Summary
| Measurement | Chinese | Cajun |
| Minimum | 82.2% | 58.4% |
| Maximum | 100.0% | 100.0% |
| Range | 17.8% | 41.6% |
| Mean | 92.7% | 83.6% |
| Median | 92.9% | 84.5% |
| Interquartile 25% (IQ1) | 90.8% | 79.8% |
| Interquartile 75% (IQ3) | 95.0% | 88.4% |
| Interquartile Range (IQR) | 4.1% | 8.7% |
| Standard Deviation (Sample) | 3.8% | 6.9% |
| Standard Deviation (Population) | 3.8% | 6.8% |
Similar Demographics by High School Diploma
Demographics Similar to Chinese by High School Diploma
In terms of high school diploma, the demographic groups most similar to Chinese are Immigrants from India (92.0%, a difference of 0.010%), Latvian (92.0%, a difference of 0.010%), Slovak (92.0%, a difference of 0.020%), Lithuanian (92.0%, a difference of 0.040%), and Slovene (92.0%, a difference of 0.040%).
| Demographics | Rating | Rank | High School Diploma |
| Norwegians | 100.0 /100 | #1 | Exceptional 92.5% |
| Swedes | 100.0 /100 | #2 | Exceptional 92.2% |
| Carpatho Rusyns | 100.0 /100 | #3 | Exceptional 92.1% |
| Lithuanians | 100.0 /100 | #4 | Exceptional 92.0% |
| Slovenes | 100.0 /100 | #5 | Exceptional 92.0% |
| Slovaks | 100.0 /100 | #6 | Exceptional 92.0% |
| Immigrants | India | 100.0 /100 | #7 | Exceptional 92.0% |
| Chinese | 100.0 /100 | #8 | Exceptional 92.0% |
| Latvians | 100.0 /100 | #9 | Exceptional 92.0% |
| Croatians | 100.0 /100 | #10 | Exceptional 92.0% |
| Eastern Europeans | 100.0 /100 | #11 | Exceptional 91.9% |
| Poles | 100.0 /100 | #12 | Exceptional 91.9% |
| Danes | 100.0 /100 | #13 | Exceptional 91.8% |
| Bulgarians | 100.0 /100 | #14 | Exceptional 91.8% |
| Luxembourgers | 100.0 /100 | #15 | Exceptional 91.7% |
Demographics Similar to Cajuns by High School Diploma
In terms of high school diploma, the demographic groups most similar to Cajuns are Seminole (87.3%, a difference of 0.020%), Immigrants from Peru (87.3%, a difference of 0.050%), Immigrants from Ghana (87.4%, a difference of 0.080%), Immigrants from Western Africa (87.4%, a difference of 0.080%), and Immigrants from South Eastern Asia (87.2%, a difference of 0.080%).
| Demographics | Rating | Rank | High School Diploma |
| Immigrants | Uruguay | 1.0 /100 | #253 | Tragic 87.6% |
| Immigrants | Colombia | 1.0 /100 | #254 | Tragic 87.6% |
| Immigrants | Senegal | 0.9 /100 | #255 | Tragic 87.6% |
| Africans | 0.7 /100 | #256 | Tragic 87.5% |
| Bahamians | 0.7 /100 | #257 | Tragic 87.5% |
| Immigrants | Ghana | 0.5 /100 | #258 | Tragic 87.4% |
| Immigrants | Western Africa | 0.5 /100 | #259 | Tragic 87.4% |
| Cajuns | 0.4 /100 | #260 | Tragic 87.3% |
| Seminole | 0.4 /100 | #261 | Tragic 87.3% |
| Immigrants | Peru | 0.4 /100 | #262 | Tragic 87.3% |
| Immigrants | South Eastern Asia | 0.3 /100 | #263 | Tragic 87.2% |
| Jamaicans | 0.3 /100 | #264 | Tragic 87.2% |
| U.S. Virgin Islanders | 0.2 /100 | #265 | Tragic 87.1% |
| Immigrants | Congo | 0.2 /100 | #266 | Tragic 87.0% |
| Blacks/African Americans | 0.2 /100 | #267 | Tragic 87.0% |