Immigrants from Spain vs Cajun Median Female Earnings
COMPARE
Immigrants from Spain
Cajun
Median Female Earnings
Median Female Earnings Comparison
Immigrants from Spain
Cajuns
$42,815
MEDIAN FEMALE EARNINGS
99.8/ 100
METRIC RATING
69th/ 347
METRIC RANK
$34,034
MEDIAN FEMALE EARNINGS
0.0/ 100
METRIC RATING
327th/ 347
METRIC RANK
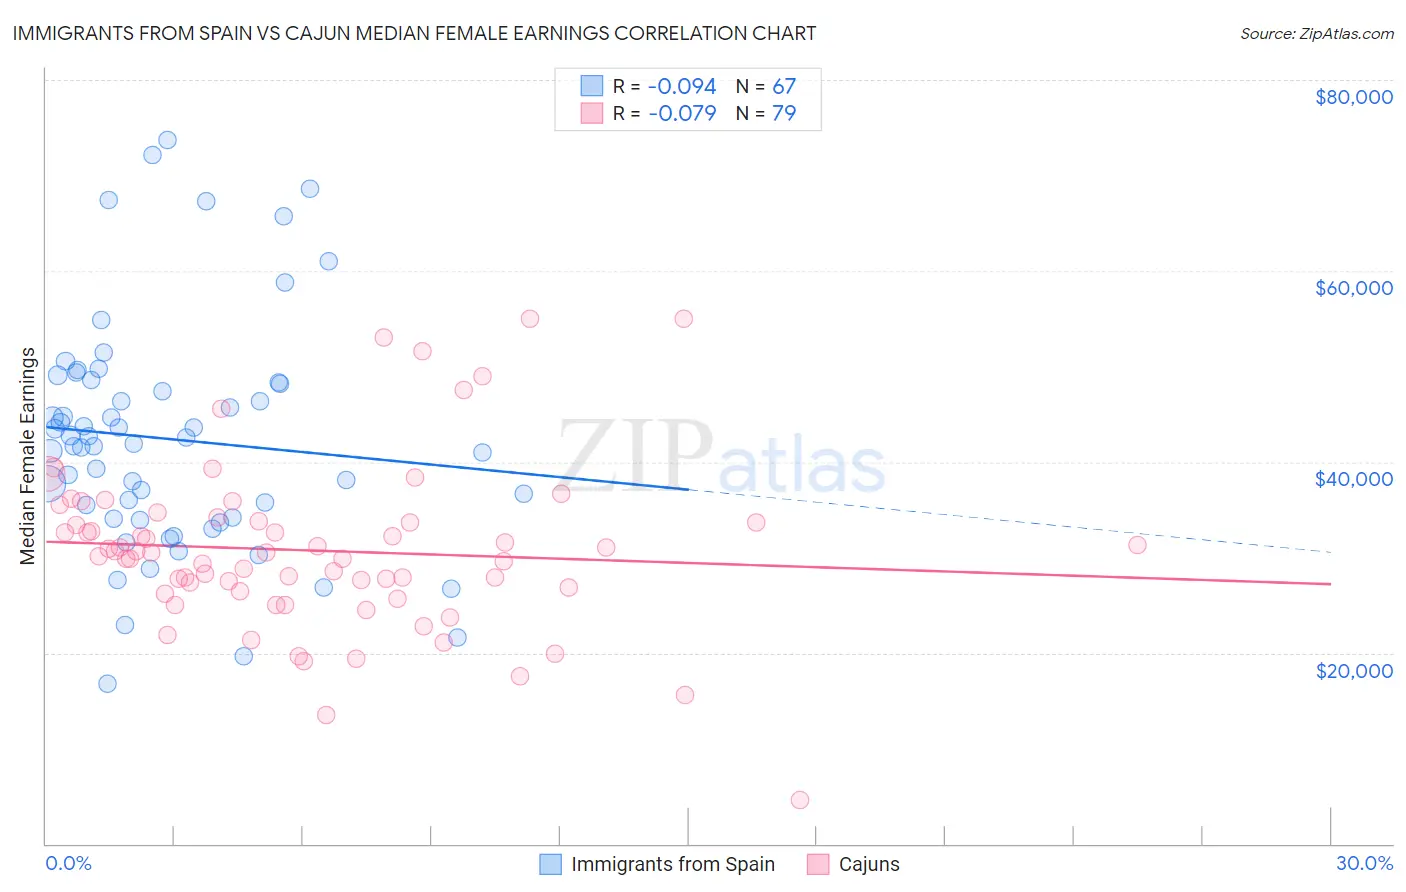
Immigrants from Spain vs Cajun Median Female Earnings Correlation Chart
The statistical analysis conducted on geographies consisting of 239,646,958 people shows a slight negative correlation between the proportion of Immigrants from Spain and median female earnings in the United States with a correlation coefficient (R) of -0.094 and weighted average of $42,815. Similarly, the statistical analysis conducted on geographies consisting of 149,646,456 people shows a slight negative correlation between the proportion of Cajuns and median female earnings in the United States with a correlation coefficient (R) of -0.079 and weighted average of $34,034, a difference of 25.8%.
Median Female Earnings Correlation Summary
| Measurement | Immigrants from Spain | Cajun |
| Minimum | $16,765 | $4,615 |
| Maximum | $73,707 | $55,000 |
| Range | $56,942 | $50,385 |
| Mean | $42,367 | $30,723 |
| Median | $41,842 | $30,456 |
| Interquartile 25% (IQ1) | $34,065 | $26,402 |
| Interquartile 75% (IQ3) | $48,345 | $33,785 |
| Interquartile Range (IQR) | $14,280 | $7,382 |
| Standard Deviation (Sample) | $12,186 | $8,808 |
| Standard Deviation (Population) | $12,095 | $8,752 |
Similar Demographics by Median Female Earnings
Demographics Similar to Immigrants from Spain by Median Female Earnings
In terms of median female earnings, the demographic groups most similar to Immigrants from Spain are Immigrants from Austria ($42,824, a difference of 0.020%), Immigrants from Norway ($42,837, a difference of 0.050%), Immigrants from Egypt ($42,837, a difference of 0.050%), Sierra Leonean ($42,868, a difference of 0.12%), and Immigrants from Ethiopia ($42,744, a difference of 0.17%).
| Demographics | Rating | Rank | Median Female Earnings |
| Afghans | 99.9 /100 | #62 | Exceptional $43,077 |
| Immigrants | Ukraine | 99.9 /100 | #63 | Exceptional $43,069 |
| Immigrants | Pakistan | 99.9 /100 | #64 | Exceptional $43,052 |
| Sierra Leoneans | 99.9 /100 | #65 | Exceptional $42,868 |
| Immigrants | Norway | 99.9 /100 | #66 | Exceptional $42,837 |
| Immigrants | Egypt | 99.9 /100 | #67 | Exceptional $42,837 |
| Immigrants | Austria | 99.8 /100 | #68 | Exceptional $42,824 |
| Immigrants | Spain | 99.8 /100 | #69 | Exceptional $42,815 |
| Immigrants | Ethiopia | 99.8 /100 | #70 | Exceptional $42,744 |
| Immigrants | Romania | 99.8 /100 | #71 | Exceptional $42,718 |
| Albanians | 99.8 /100 | #72 | Exceptional $42,584 |
| Mongolians | 99.7 /100 | #73 | Exceptional $42,542 |
| Immigrants | South Africa | 99.7 /100 | #74 | Exceptional $42,508 |
| New Zealanders | 99.7 /100 | #75 | Exceptional $42,446 |
| Immigrants | Italy | 99.7 /100 | #76 | Exceptional $42,446 |
Demographics Similar to Cajuns by Median Female Earnings
In terms of median female earnings, the demographic groups most similar to Cajuns are Kiowa ($34,074, a difference of 0.12%), Dutch West Indian ($34,106, a difference of 0.21%), Immigrants from Central America ($33,953, a difference of 0.24%), Hopi ($33,932, a difference of 0.30%), and Menominee ($33,894, a difference of 0.41%).
| Demographics | Rating | Rank | Median Female Earnings |
| Immigrants | Honduras | 0.0 /100 | #320 | Tragic $34,647 |
| Hispanics or Latinos | 0.0 /100 | #321 | Tragic $34,421 |
| Chickasaw | 0.0 /100 | #322 | Tragic $34,414 |
| Seminole | 0.0 /100 | #323 | Tragic $34,385 |
| Immigrants | Congo | 0.0 /100 | #324 | Tragic $34,317 |
| Dutch West Indians | 0.0 /100 | #325 | Tragic $34,106 |
| Kiowa | 0.0 /100 | #326 | Tragic $34,074 |
| Cajuns | 0.0 /100 | #327 | Tragic $34,034 |
| Immigrants | Central America | 0.0 /100 | #328 | Tragic $33,953 |
| Hopi | 0.0 /100 | #329 | Tragic $33,932 |
| Menominee | 0.0 /100 | #330 | Tragic $33,894 |
| Natives/Alaskans | 0.0 /100 | #331 | Tragic $33,806 |
| Choctaw | 0.0 /100 | #332 | Tragic $33,775 |
| Mexicans | 0.0 /100 | #333 | Tragic $33,664 |
| Spanish American Indians | 0.0 /100 | #334 | Tragic $33,625 |