Bangladeshi vs Panamanian Per Capita Income
COMPARE
Bangladeshi
Panamanian
Per Capita Income
Per Capita Income Comparison
Bangladeshis
Panamanians
$35,897
PER CAPITA INCOME
0.0/ 100
METRIC RATING
318th/ 347
METRIC RANK
$42,035
PER CAPITA INCOME
13.9/ 100
METRIC RATING
208th/ 347
METRIC RANK
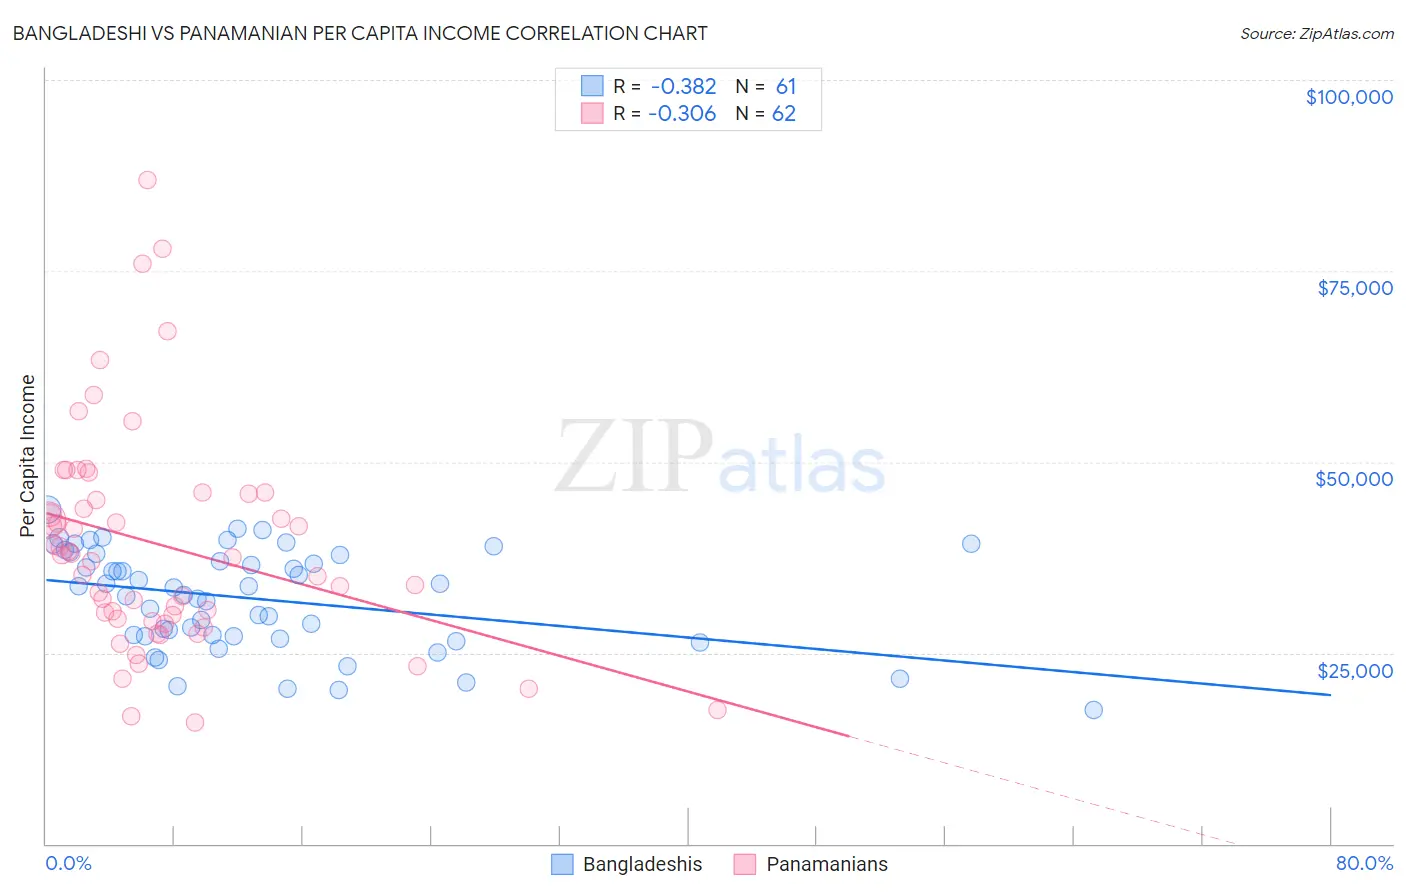
Bangladeshi vs Panamanian Per Capita Income Correlation Chart
The statistical analysis conducted on geographies consisting of 141,454,199 people shows a mild negative correlation between the proportion of Bangladeshis and per capita income in the United States with a correlation coefficient (R) of -0.382 and weighted average of $35,897. Similarly, the statistical analysis conducted on geographies consisting of 281,258,630 people shows a mild negative correlation between the proportion of Panamanians and per capita income in the United States with a correlation coefficient (R) of -0.306 and weighted average of $42,035, a difference of 17.1%.
Per Capita Income Correlation Summary
| Measurement | Bangladeshi | Panamanian |
| Minimum | $17,577 | $15,844 |
| Maximum | $43,772 | $86,907 |
| Range | $26,195 | $71,063 |
| Mean | $32,070 | $39,085 |
| Median | $33,478 | $37,643 |
| Interquartile 25% (IQ1) | $27,131 | $29,415 |
| Interquartile 75% (IQ3) | $37,833 | $45,746 |
| Interquartile Range (IQR) | $10,702 | $16,331 |
| Standard Deviation (Sample) | $6,476 | $14,450 |
| Standard Deviation (Population) | $6,423 | $14,333 |
Similar Demographics by Per Capita Income
Demographics Similar to Bangladeshis by Per Capita Income
In terms of per capita income, the demographic groups most similar to Bangladeshis are Dutch West Indian ($35,922, a difference of 0.070%), Choctaw ($35,999, a difference of 0.28%), Immigrants from Congo ($35,720, a difference of 0.50%), Hispanic or Latino ($35,688, a difference of 0.59%), and Yaqui ($36,112, a difference of 0.60%).
| Demographics | Rating | Rank | Per Capita Income |
| Chippewa | 0.0 /100 | #311 | Tragic $36,631 |
| Chickasaw | 0.0 /100 | #312 | Tragic $36,475 |
| Bahamians | 0.0 /100 | #313 | Tragic $36,427 |
| Seminole | 0.0 /100 | #314 | Tragic $36,180 |
| Yaqui | 0.0 /100 | #315 | Tragic $36,112 |
| Choctaw | 0.0 /100 | #316 | Tragic $35,999 |
| Dutch West Indians | 0.0 /100 | #317 | Tragic $35,922 |
| Bangladeshis | 0.0 /100 | #318 | Tragic $35,897 |
| Immigrants | Congo | 0.0 /100 | #319 | Tragic $35,720 |
| Hispanics or Latinos | 0.0 /100 | #320 | Tragic $35,688 |
| Blacks/African Americans | 0.0 /100 | #321 | Tragic $35,564 |
| Creek | 0.0 /100 | #322 | Tragic $35,546 |
| Cheyenne | 0.0 /100 | #323 | Tragic $35,276 |
| Kiowa | 0.0 /100 | #324 | Tragic $35,102 |
| Immigrants | Central America | 0.0 /100 | #325 | Tragic $34,974 |
Demographics Similar to Panamanians by Per Capita Income
In terms of per capita income, the demographic groups most similar to Panamanians are Venezuelan ($42,074, a difference of 0.090%), Immigrants from Sudan ($41,986, a difference of 0.12%), Ecuadorian ($41,958, a difference of 0.18%), Ghanaian ($42,164, a difference of 0.31%), and White/Caucasian ($42,180, a difference of 0.35%).
| Demographics | Rating | Rank | Per Capita Income |
| Immigrants | Thailand | 17.6 /100 | #201 | Poor $42,289 |
| Immigrants | Bosnia and Herzegovina | 17.5 /100 | #202 | Poor $42,278 |
| Spanish | 17.0 /100 | #203 | Poor $42,249 |
| Aleuts | 16.4 /100 | #204 | Poor $42,210 |
| Whites/Caucasians | 15.9 /100 | #205 | Poor $42,180 |
| Ghanaians | 15.7 /100 | #206 | Poor $42,164 |
| Venezuelans | 14.4 /100 | #207 | Poor $42,074 |
| Panamanians | 13.9 /100 | #208 | Poor $42,035 |
| Immigrants | Sudan | 13.2 /100 | #209 | Poor $41,986 |
| Ecuadorians | 12.9 /100 | #210 | Poor $41,958 |
| Immigrants | Panama | 11.6 /100 | #211 | Poor $41,853 |
| Immigrants | Senegal | 11.3 /100 | #212 | Poor $41,830 |
| Immigrants | Venezuela | 10.2 /100 | #213 | Poor $41,727 |
| Immigrants | Bangladesh | 10.1 /100 | #214 | Poor $41,709 |
| Sudanese | 9.9 /100 | #215 | Tragic $41,695 |