Egyptian vs Panamanian Per Capita Income
COMPARE
Egyptian
Panamanian
Per Capita Income
Per Capita Income Comparison
Egyptians
Panamanians
$48,358
PER CAPITA INCOME
99.5/ 100
METRIC RATING
80th/ 347
METRIC RANK
$42,035
PER CAPITA INCOME
13.9/ 100
METRIC RATING
208th/ 347
METRIC RANK
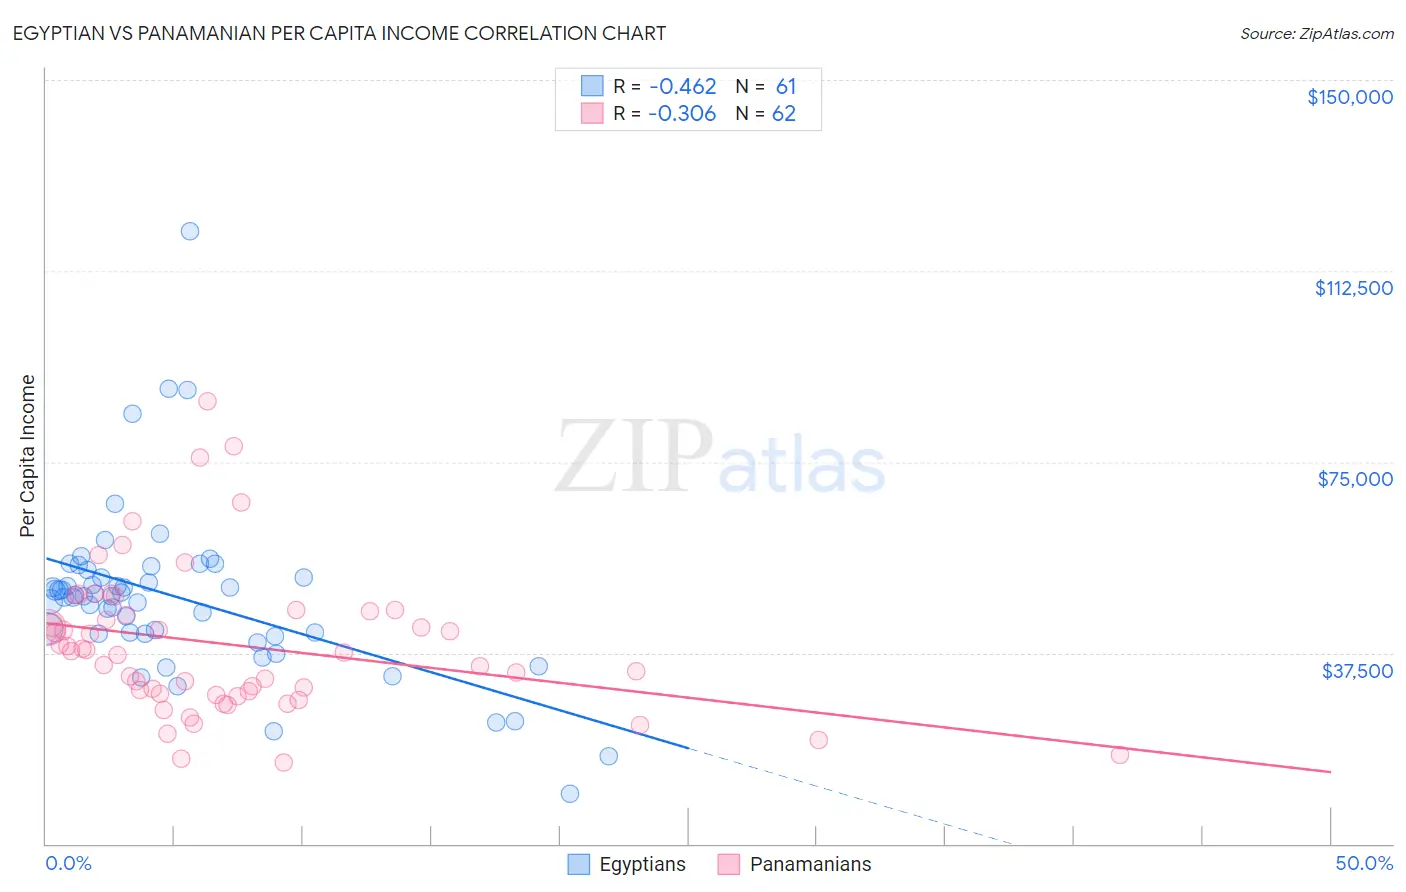
Egyptian vs Panamanian Per Capita Income Correlation Chart
The statistical analysis conducted on geographies consisting of 276,936,692 people shows a moderate negative correlation between the proportion of Egyptians and per capita income in the United States with a correlation coefficient (R) of -0.462 and weighted average of $48,358. Similarly, the statistical analysis conducted on geographies consisting of 281,258,630 people shows a mild negative correlation between the proportion of Panamanians and per capita income in the United States with a correlation coefficient (R) of -0.306 and weighted average of $42,035, a difference of 15.0%.
Per Capita Income Correlation Summary
| Measurement | Egyptian | Panamanian |
| Minimum | $9,805 | $15,844 |
| Maximum | $120,225 | $86,907 |
| Range | $110,420 | $71,063 |
| Mean | $48,391 | $39,085 |
| Median | $48,690 | $37,643 |
| Interquartile 25% (IQ1) | $41,170 | $29,415 |
| Interquartile 75% (IQ3) | $53,076 | $45,746 |
| Interquartile Range (IQR) | $11,906 | $16,331 |
| Standard Deviation (Sample) | $16,881 | $14,450 |
| Standard Deviation (Population) | $16,742 | $14,333 |
Similar Demographics by Per Capita Income
Demographics Similar to Egyptians by Per Capita Income
In terms of per capita income, the demographic groups most similar to Egyptians are Armenian ($48,287, a difference of 0.15%), Romanian ($48,445, a difference of 0.18%), Immigrants from Indonesia ($48,195, a difference of 0.34%), Immigrants from Brazil ($48,164, a difference of 0.40%), and Immigrants from Ukraine ($48,134, a difference of 0.46%).
| Demographics | Rating | Rank | Per Capita Income |
| Immigrants | North America | 99.8 /100 | #73 | Exceptional $49,302 |
| Mongolians | 99.8 /100 | #74 | Exceptional $49,173 |
| Immigrants | Bolivia | 99.7 /100 | #75 | Exceptional $48,970 |
| Immigrants | England | 99.7 /100 | #76 | Exceptional $48,844 |
| Immigrants | Kazakhstan | 99.7 /100 | #77 | Exceptional $48,747 |
| Immigrants | Italy | 99.6 /100 | #78 | Exceptional $48,654 |
| Romanians | 99.5 /100 | #79 | Exceptional $48,445 |
| Egyptians | 99.5 /100 | #80 | Exceptional $48,358 |
| Armenians | 99.4 /100 | #81 | Exceptional $48,287 |
| Immigrants | Indonesia | 99.4 /100 | #82 | Exceptional $48,195 |
| Immigrants | Brazil | 99.4 /100 | #83 | Exceptional $48,164 |
| Immigrants | Ukraine | 99.3 /100 | #84 | Exceptional $48,134 |
| Austrians | 99.3 /100 | #85 | Exceptional $48,116 |
| Immigrants | Southern Europe | 99.3 /100 | #86 | Exceptional $48,027 |
| Ukrainians | 99.3 /100 | #87 | Exceptional $48,014 |
Demographics Similar to Panamanians by Per Capita Income
In terms of per capita income, the demographic groups most similar to Panamanians are Venezuelan ($42,074, a difference of 0.090%), Immigrants from Sudan ($41,986, a difference of 0.12%), Ecuadorian ($41,958, a difference of 0.18%), Ghanaian ($42,164, a difference of 0.31%), and White/Caucasian ($42,180, a difference of 0.35%).
| Demographics | Rating | Rank | Per Capita Income |
| Immigrants | Thailand | 17.6 /100 | #201 | Poor $42,289 |
| Immigrants | Bosnia and Herzegovina | 17.5 /100 | #202 | Poor $42,278 |
| Spanish | 17.0 /100 | #203 | Poor $42,249 |
| Aleuts | 16.4 /100 | #204 | Poor $42,210 |
| Whites/Caucasians | 15.9 /100 | #205 | Poor $42,180 |
| Ghanaians | 15.7 /100 | #206 | Poor $42,164 |
| Venezuelans | 14.4 /100 | #207 | Poor $42,074 |
| Panamanians | 13.9 /100 | #208 | Poor $42,035 |
| Immigrants | Sudan | 13.2 /100 | #209 | Poor $41,986 |
| Ecuadorians | 12.9 /100 | #210 | Poor $41,958 |
| Immigrants | Panama | 11.6 /100 | #211 | Poor $41,853 |
| Immigrants | Senegal | 11.3 /100 | #212 | Poor $41,830 |
| Immigrants | Venezuela | 10.2 /100 | #213 | Poor $41,727 |
| Immigrants | Bangladesh | 10.1 /100 | #214 | Poor $41,709 |
| Sudanese | 9.9 /100 | #215 | Tragic $41,695 |