Immigrants from Colombia vs Panamanian Per Capita Income
COMPARE
Immigrants from Colombia
Panamanian
Per Capita Income
Per Capita Income Comparison
Immigrants from Colombia
Panamanians
$42,971
PER CAPITA INCOME
31.5/ 100
METRIC RATING
187th/ 347
METRIC RANK
$42,035
PER CAPITA INCOME
13.9/ 100
METRIC RATING
208th/ 347
METRIC RANK
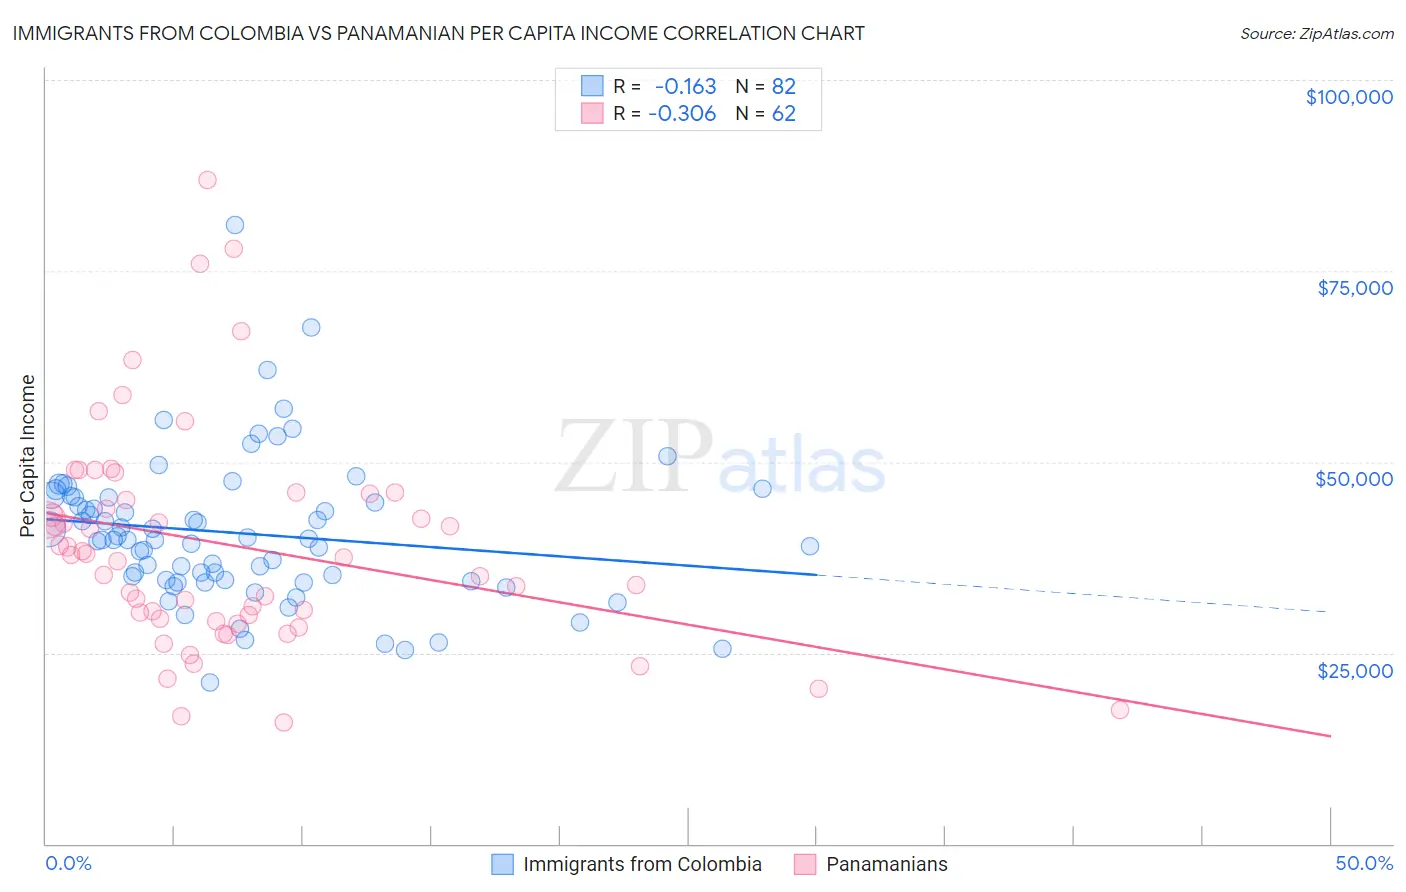
Immigrants from Colombia vs Panamanian Per Capita Income Correlation Chart
The statistical analysis conducted on geographies consisting of 378,698,677 people shows a poor negative correlation between the proportion of Immigrants from Colombia and per capita income in the United States with a correlation coefficient (R) of -0.163 and weighted average of $42,971. Similarly, the statistical analysis conducted on geographies consisting of 281,258,630 people shows a mild negative correlation between the proportion of Panamanians and per capita income in the United States with a correlation coefficient (R) of -0.306 and weighted average of $42,035, a difference of 2.2%.
Per Capita Income Correlation Summary
| Measurement | Immigrants from Colombia | Panamanian |
| Minimum | $21,139 | $15,844 |
| Maximum | $80,934 | $86,907 |
| Range | $59,795 | $71,063 |
| Mean | $40,659 | $39,085 |
| Median | $39,822 | $37,643 |
| Interquartile 25% (IQ1) | $34,523 | $29,415 |
| Interquartile 75% (IQ3) | $45,376 | $45,746 |
| Interquartile Range (IQR) | $10,853 | $16,331 |
| Standard Deviation (Sample) | $9,573 | $14,450 |
| Standard Deviation (Population) | $9,515 | $14,333 |
Similar Demographics by Per Capita Income
Demographics Similar to Immigrants from Colombia by Per Capita Income
In terms of per capita income, the demographic groups most similar to Immigrants from Colombia are Immigrants from Africa ($42,950, a difference of 0.050%), French Canadian ($43,003, a difference of 0.070%), Immigrants ($43,010, a difference of 0.090%), Spaniard ($43,028, a difference of 0.13%), and Bermudan ($42,911, a difference of 0.14%).
| Demographics | Rating | Rank | Per Capita Income |
| Sierra Leoneans | 42.9 /100 | #180 | Average $43,405 |
| Welsh | 38.2 /100 | #181 | Fair $43,233 |
| Immigrants | Vietnam | 38.1 /100 | #182 | Fair $43,229 |
| Germans | 33.9 /100 | #183 | Fair $43,067 |
| Spaniards | 32.9 /100 | #184 | Fair $43,028 |
| Immigrants | Immigrants | 32.5 /100 | #185 | Fair $43,010 |
| French Canadians | 32.3 /100 | #186 | Fair $43,003 |
| Immigrants | Colombia | 31.5 /100 | #187 | Fair $42,971 |
| Immigrants | Africa | 31.0 /100 | #188 | Fair $42,950 |
| Bermudans | 30.1 /100 | #189 | Fair $42,911 |
| Kenyans | 27.7 /100 | #190 | Fair $42,808 |
| Yugoslavians | 27.4 /100 | #191 | Fair $42,792 |
| Iraqis | 26.7 /100 | #192 | Fair $42,760 |
| Immigrants | Sierra Leone | 26.5 /100 | #193 | Fair $42,752 |
| Immigrants | Fiji | 25.2 /100 | #194 | Fair $42,694 |
Demographics Similar to Panamanians by Per Capita Income
In terms of per capita income, the demographic groups most similar to Panamanians are Venezuelan ($42,074, a difference of 0.090%), Immigrants from Sudan ($41,986, a difference of 0.12%), Ecuadorian ($41,958, a difference of 0.18%), Ghanaian ($42,164, a difference of 0.31%), and White/Caucasian ($42,180, a difference of 0.35%).
| Demographics | Rating | Rank | Per Capita Income |
| Immigrants | Thailand | 17.6 /100 | #201 | Poor $42,289 |
| Immigrants | Bosnia and Herzegovina | 17.5 /100 | #202 | Poor $42,278 |
| Spanish | 17.0 /100 | #203 | Poor $42,249 |
| Aleuts | 16.4 /100 | #204 | Poor $42,210 |
| Whites/Caucasians | 15.9 /100 | #205 | Poor $42,180 |
| Ghanaians | 15.7 /100 | #206 | Poor $42,164 |
| Venezuelans | 14.4 /100 | #207 | Poor $42,074 |
| Panamanians | 13.9 /100 | #208 | Poor $42,035 |
| Immigrants | Sudan | 13.2 /100 | #209 | Poor $41,986 |
| Ecuadorians | 12.9 /100 | #210 | Poor $41,958 |
| Immigrants | Panama | 11.6 /100 | #211 | Poor $41,853 |
| Immigrants | Senegal | 11.3 /100 | #212 | Poor $41,830 |
| Immigrants | Venezuela | 10.2 /100 | #213 | Poor $41,727 |
| Immigrants | Bangladesh | 10.1 /100 | #214 | Poor $41,709 |
| Sudanese | 9.9 /100 | #215 | Tragic $41,695 |