Chickasaw vs Ghanaian Median Female Earnings
COMPARE
Chickasaw
Ghanaian
Median Female Earnings
Median Female Earnings Comparison
Chickasaw
Ghanaians
$34,414
MEDIAN FEMALE EARNINGS
0.0/ 100
METRIC RATING
322nd/ 347
METRIC RANK
$40,429
MEDIAN FEMALE EARNINGS
82.1/ 100
METRIC RATING
146th/ 347
METRIC RANK
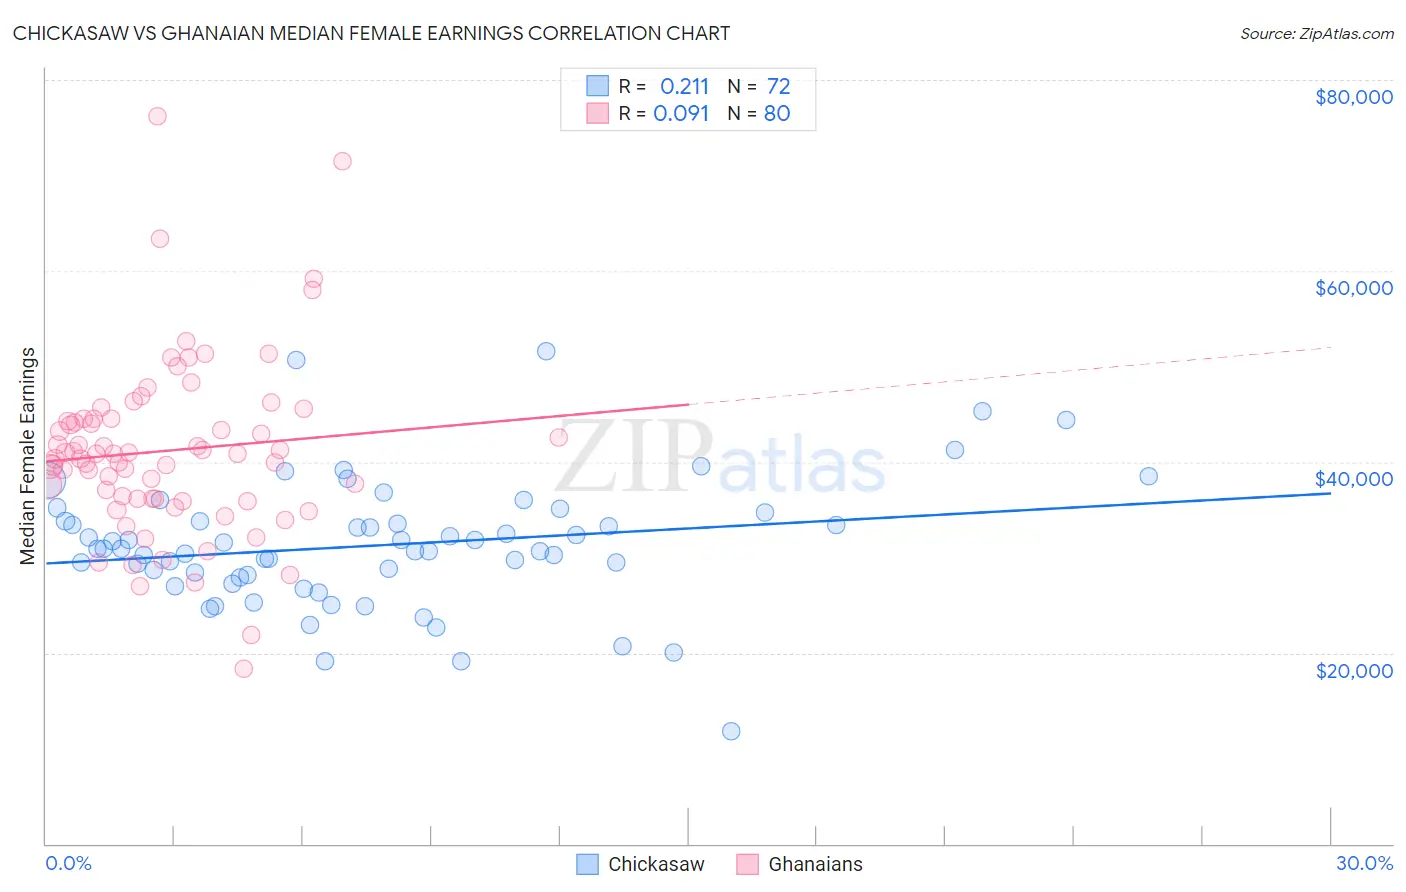
Chickasaw vs Ghanaian Median Female Earnings Correlation Chart
The statistical analysis conducted on geographies consisting of 147,680,530 people shows a weak positive correlation between the proportion of Chickasaw and median female earnings in the United States with a correlation coefficient (R) of 0.211 and weighted average of $34,414. Similarly, the statistical analysis conducted on geographies consisting of 190,707,731 people shows a slight positive correlation between the proportion of Ghanaians and median female earnings in the United States with a correlation coefficient (R) of 0.091 and weighted average of $40,429, a difference of 17.5%.
Median Female Earnings Correlation Summary
| Measurement | Chickasaw | Ghanaian |
| Minimum | $11,797 | $18,266 |
| Maximum | $51,543 | $76,246 |
| Range | $39,746 | $57,980 |
| Mean | $31,266 | $41,171 |
| Median | $30,877 | $40,828 |
| Interquartile 25% (IQ1) | $28,026 | $36,123 |
| Interquartile 75% (IQ3) | $33,779 | $44,535 |
| Interquartile Range (IQR) | $5,753 | $8,413 |
| Standard Deviation (Sample) | $6,735 | $9,292 |
| Standard Deviation (Population) | $6,688 | $9,234 |
Similar Demographics by Median Female Earnings
Demographics Similar to Chickasaw by Median Female Earnings
In terms of median female earnings, the demographic groups most similar to Chickasaw are Hispanic or Latino ($34,421, a difference of 0.020%), Seminole ($34,385, a difference of 0.080%), Immigrants from Congo ($34,317, a difference of 0.28%), Immigrants from Honduras ($34,647, a difference of 0.68%), and Shoshone ($34,677, a difference of 0.76%).
| Demographics | Rating | Rank | Median Female Earnings |
| Pennsylvania Germans | 0.0 /100 | #315 | Tragic $34,802 |
| Cherokee | 0.0 /100 | #316 | Tragic $34,742 |
| Potawatomi | 0.0 /100 | #317 | Tragic $34,739 |
| Immigrants | Yemen | 0.0 /100 | #318 | Tragic $34,693 |
| Shoshone | 0.0 /100 | #319 | Tragic $34,677 |
| Immigrants | Honduras | 0.0 /100 | #320 | Tragic $34,647 |
| Hispanics or Latinos | 0.0 /100 | #321 | Tragic $34,421 |
| Chickasaw | 0.0 /100 | #322 | Tragic $34,414 |
| Seminole | 0.0 /100 | #323 | Tragic $34,385 |
| Immigrants | Congo | 0.0 /100 | #324 | Tragic $34,317 |
| Dutch West Indians | 0.0 /100 | #325 | Tragic $34,106 |
| Kiowa | 0.0 /100 | #326 | Tragic $34,074 |
| Cajuns | 0.0 /100 | #327 | Tragic $34,034 |
| Immigrants | Central America | 0.0 /100 | #328 | Tragic $33,953 |
| Hopi | 0.0 /100 | #329 | Tragic $33,932 |
Demographics Similar to Ghanaians by Median Female Earnings
In terms of median female earnings, the demographic groups most similar to Ghanaians are Brazilian ($40,483, a difference of 0.13%), Vietnamese ($40,377, a difference of 0.13%), Northern European ($40,491, a difference of 0.15%), Immigrants from North Macedonia ($40,488, a difference of 0.15%), and Polish ($40,371, a difference of 0.15%).
| Demographics | Rating | Rank | Median Female Earnings |
| Immigrants | South Eastern Asia | 85.7 /100 | #139 | Excellent $40,558 |
| Serbians | 85.2 /100 | #140 | Excellent $40,539 |
| Immigrants | Syria | 84.1 /100 | #141 | Excellent $40,499 |
| Sri Lankans | 84.0 /100 | #142 | Excellent $40,496 |
| Northern Europeans | 83.9 /100 | #143 | Excellent $40,491 |
| Immigrants | North Macedonia | 83.8 /100 | #144 | Excellent $40,488 |
| Brazilians | 83.6 /100 | #145 | Excellent $40,483 |
| Ghanaians | 82.1 /100 | #146 | Excellent $40,429 |
| Vietnamese | 80.4 /100 | #147 | Excellent $40,377 |
| Poles | 80.2 /100 | #148 | Excellent $40,371 |
| Immigrants | Cameroon | 79.7 /100 | #149 | Good $40,354 |
| Immigrants | Chile | 79.6 /100 | #150 | Good $40,353 |
| Immigrants | Armenia | 79.2 /100 | #151 | Good $40,340 |
| West Indians | 78.4 /100 | #152 | Good $40,317 |
| British West Indians | 77.7 /100 | #153 | Good $40,299 |