Cheyenne vs Immigrants from Thailand Median Female Earnings
COMPARE
Cheyenne
Immigrants from Thailand
Median Female Earnings
Median Female Earnings Comparison
Cheyenne
Immigrants from Thailand
$35,673
MEDIAN FEMALE EARNINGS
0.0/ 100
METRIC RATING
294th/ 347
METRIC RANK
$38,810
MEDIAN FEMALE EARNINGS
13.6/ 100
METRIC RATING
208th/ 347
METRIC RANK
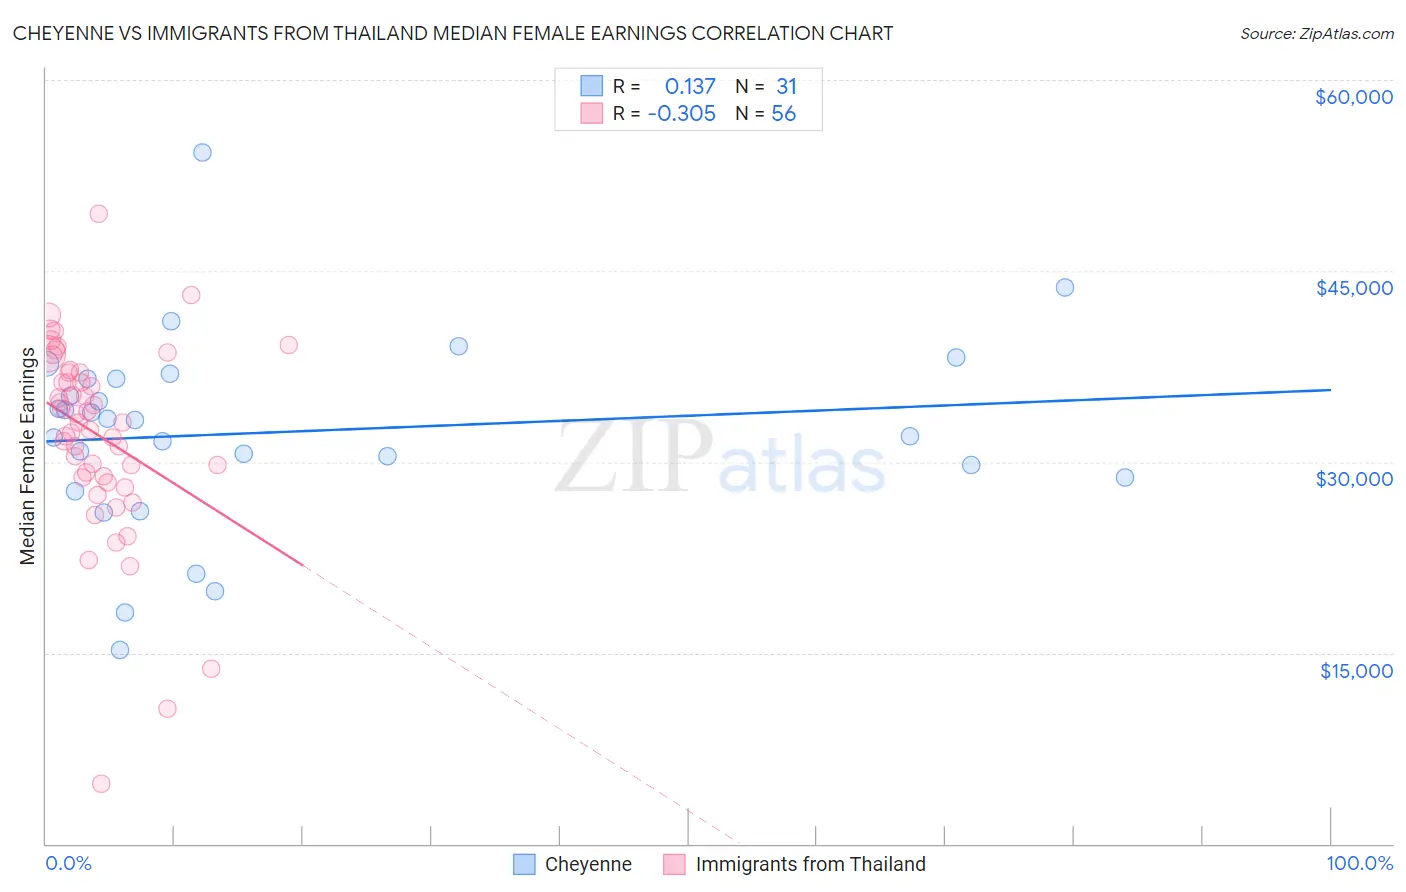
Cheyenne vs Immigrants from Thailand Median Female Earnings Correlation Chart
The statistical analysis conducted on geographies consisting of 80,682,287 people shows a poor positive correlation between the proportion of Cheyenne and median female earnings in the United States with a correlation coefficient (R) of 0.137 and weighted average of $35,673. Similarly, the statistical analysis conducted on geographies consisting of 316,955,247 people shows a mild negative correlation between the proportion of Immigrants from Thailand and median female earnings in the United States with a correlation coefficient (R) of -0.305 and weighted average of $38,810, a difference of 8.8%.
Median Female Earnings Correlation Summary
| Measurement | Cheyenne | Immigrants from Thailand |
| Minimum | $15,218 | $4,682 |
| Maximum | $54,333 | $49,527 |
| Range | $39,115 | $44,845 |
| Mean | $32,359 | $32,114 |
| Median | $33,313 | $33,058 |
| Interquartile 25% (IQ1) | $28,775 | $28,829 |
| Interquartile 75% (IQ3) | $36,563 | $37,011 |
| Interquartile Range (IQR) | $7,788 | $8,182 |
| Standard Deviation (Sample) | $7,704 | $7,697 |
| Standard Deviation (Population) | $7,579 | $7,628 |
Similar Demographics by Median Female Earnings
Demographics Similar to Cheyenne by Median Female Earnings
In terms of median female earnings, the demographic groups most similar to Cheyenne are Comanche ($35,661, a difference of 0.030%), Guatemalan ($35,695, a difference of 0.060%), Mexican American Indian ($35,629, a difference of 0.12%), American ($35,777, a difference of 0.29%), and Hmong ($35,498, a difference of 0.49%).
| Demographics | Rating | Rank | Median Female Earnings |
| Immigrants | Nicaragua | 0.0 /100 | #287 | Tragic $36,023 |
| Immigrants | Zaire | 0.0 /100 | #288 | Tragic $36,017 |
| Bangladeshis | 0.0 /100 | #289 | Tragic $35,960 |
| Central American Indians | 0.0 /100 | #290 | Tragic $35,930 |
| Blackfeet | 0.0 /100 | #291 | Tragic $35,864 |
| Americans | 0.0 /100 | #292 | Tragic $35,777 |
| Guatemalans | 0.0 /100 | #293 | Tragic $35,695 |
| Cheyenne | 0.0 /100 | #294 | Tragic $35,673 |
| Comanche | 0.0 /100 | #295 | Tragic $35,661 |
| Mexican American Indians | 0.0 /100 | #296 | Tragic $35,629 |
| Hmong | 0.0 /100 | #297 | Tragic $35,498 |
| Immigrants | Micronesia | 0.0 /100 | #298 | Tragic $35,477 |
| Immigrants | Guatemala | 0.0 /100 | #299 | Tragic $35,444 |
| Yuman | 0.0 /100 | #300 | Tragic $35,377 |
| Pima | 0.0 /100 | #301 | Tragic $35,326 |
Demographics Similar to Immigrants from Thailand by Median Female Earnings
In terms of median female earnings, the demographic groups most similar to Immigrants from Thailand are Norwegian ($38,802, a difference of 0.020%), Immigrants from Cambodia ($38,833, a difference of 0.060%), Czechoslovakian ($38,738, a difference of 0.19%), Immigrants from Bosnia and Herzegovina ($38,886, a difference of 0.20%), and Aleut ($38,719, a difference of 0.23%).
| Demographics | Rating | Rank | Median Female Earnings |
| Panamanians | 20.6 /100 | #201 | Fair $39,049 |
| Slovaks | 19.9 /100 | #202 | Poor $39,029 |
| Czechs | 18.7 /100 | #203 | Poor $38,992 |
| Immigrants | Uruguay | 17.3 /100 | #204 | Poor $38,945 |
| Immigrants | Colombia | 16.3 /100 | #205 | Poor $38,913 |
| Immigrants | Bosnia and Herzegovina | 15.6 /100 | #206 | Poor $38,886 |
| Immigrants | Cambodia | 14.2 /100 | #207 | Poor $38,833 |
| Immigrants | Thailand | 13.6 /100 | #208 | Poor $38,810 |
| Norwegians | 13.4 /100 | #209 | Poor $38,802 |
| Czechoslovakians | 12.0 /100 | #210 | Poor $38,738 |
| Aleuts | 11.6 /100 | #211 | Poor $38,719 |
| Guamanians/Chamorros | 11.5 /100 | #212 | Poor $38,717 |
| Jamaicans | 10.5 /100 | #213 | Poor $38,670 |
| Iraqis | 10.5 /100 | #214 | Poor $38,666 |
| Spaniards | 10.3 /100 | #215 | Poor $38,656 |