Cheyenne vs Immigrants from Belarus Median Female Earnings
COMPARE
Cheyenne
Immigrants from Belarus
Median Female Earnings
Median Female Earnings Comparison
Cheyenne
Immigrants from Belarus
$35,673
MEDIAN FEMALE EARNINGS
0.0/ 100
METRIC RATING
294th/ 347
METRIC RANK
$44,757
MEDIAN FEMALE EARNINGS
100.0/ 100
METRIC RATING
26th/ 347
METRIC RANK
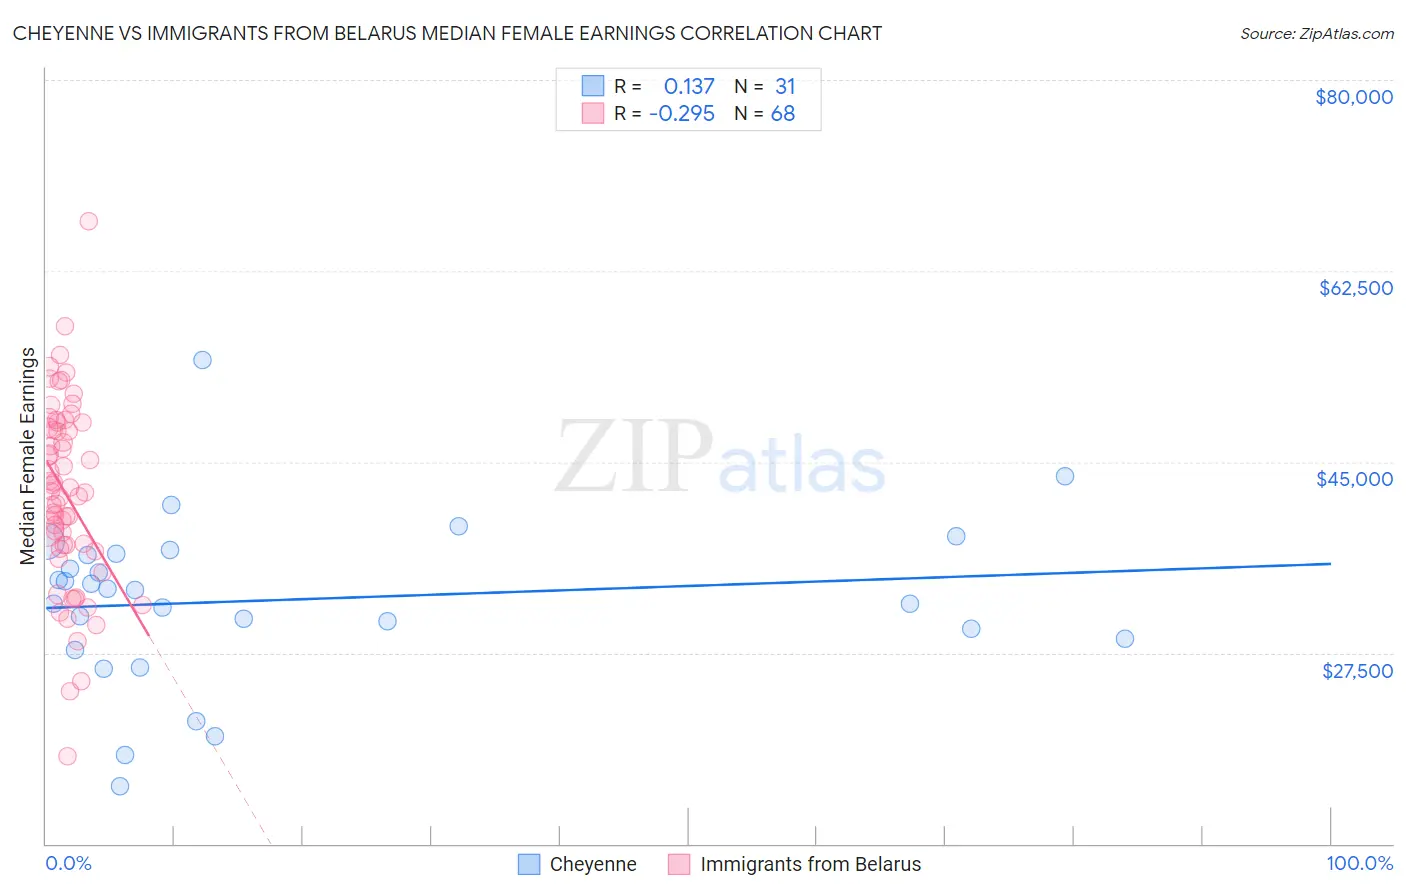
Cheyenne vs Immigrants from Belarus Median Female Earnings Correlation Chart
The statistical analysis conducted on geographies consisting of 80,682,287 people shows a poor positive correlation between the proportion of Cheyenne and median female earnings in the United States with a correlation coefficient (R) of 0.137 and weighted average of $35,673. Similarly, the statistical analysis conducted on geographies consisting of 150,178,879 people shows a weak negative correlation between the proportion of Immigrants from Belarus and median female earnings in the United States with a correlation coefficient (R) of -0.295 and weighted average of $44,757, a difference of 25.5%.
Median Female Earnings Correlation Summary
| Measurement | Cheyenne | Immigrants from Belarus |
| Minimum | $15,218 | $17,969 |
| Maximum | $54,333 | $67,083 |
| Range | $39,115 | $49,114 |
| Mean | $32,359 | $42,072 |
| Median | $33,313 | $42,243 |
| Interquartile 25% (IQ1) | $28,775 | $37,178 |
| Interquartile 75% (IQ3) | $36,563 | $48,362 |
| Interquartile Range (IQR) | $7,788 | $11,183 |
| Standard Deviation (Sample) | $7,704 | $8,617 |
| Standard Deviation (Population) | $7,579 | $8,553 |
Similar Demographics by Median Female Earnings
Demographics Similar to Cheyenne by Median Female Earnings
In terms of median female earnings, the demographic groups most similar to Cheyenne are Comanche ($35,661, a difference of 0.030%), Guatemalan ($35,695, a difference of 0.060%), Mexican American Indian ($35,629, a difference of 0.12%), American ($35,777, a difference of 0.29%), and Hmong ($35,498, a difference of 0.49%).
| Demographics | Rating | Rank | Median Female Earnings |
| Immigrants | Nicaragua | 0.0 /100 | #287 | Tragic $36,023 |
| Immigrants | Zaire | 0.0 /100 | #288 | Tragic $36,017 |
| Bangladeshis | 0.0 /100 | #289 | Tragic $35,960 |
| Central American Indians | 0.0 /100 | #290 | Tragic $35,930 |
| Blackfeet | 0.0 /100 | #291 | Tragic $35,864 |
| Americans | 0.0 /100 | #292 | Tragic $35,777 |
| Guatemalans | 0.0 /100 | #293 | Tragic $35,695 |
| Cheyenne | 0.0 /100 | #294 | Tragic $35,673 |
| Comanche | 0.0 /100 | #295 | Tragic $35,661 |
| Mexican American Indians | 0.0 /100 | #296 | Tragic $35,629 |
| Hmong | 0.0 /100 | #297 | Tragic $35,498 |
| Immigrants | Micronesia | 0.0 /100 | #298 | Tragic $35,477 |
| Immigrants | Guatemala | 0.0 /100 | #299 | Tragic $35,444 |
| Yuman | 0.0 /100 | #300 | Tragic $35,377 |
| Pima | 0.0 /100 | #301 | Tragic $35,326 |
Demographics Similar to Immigrants from Belarus by Median Female Earnings
In terms of median female earnings, the demographic groups most similar to Immigrants from Belarus are Immigrants from Sweden ($44,774, a difference of 0.040%), Turkish ($44,695, a difference of 0.14%), Immigrants from Russia ($44,680, a difference of 0.17%), Immigrants from Korea ($44,847, a difference of 0.20%), and Burmese ($44,911, a difference of 0.34%).
| Demographics | Rating | Rank | Median Female Earnings |
| Eastern Europeans | 100.0 /100 | #19 | Exceptional $45,385 |
| Immigrants | Japan | 100.0 /100 | #20 | Exceptional $45,323 |
| Cambodians | 100.0 /100 | #21 | Exceptional $45,014 |
| Immigrants | Greece | 100.0 /100 | #22 | Exceptional $44,976 |
| Burmese | 100.0 /100 | #23 | Exceptional $44,911 |
| Immigrants | Korea | 100.0 /100 | #24 | Exceptional $44,847 |
| Immigrants | Sweden | 100.0 /100 | #25 | Exceptional $44,774 |
| Immigrants | Belarus | 100.0 /100 | #26 | Exceptional $44,757 |
| Turks | 100.0 /100 | #27 | Exceptional $44,695 |
| Immigrants | Russia | 100.0 /100 | #28 | Exceptional $44,680 |
| Immigrants | Belgium | 100.0 /100 | #29 | Exceptional $44,587 |
| Asians | 100.0 /100 | #30 | Exceptional $44,586 |
| Immigrants | France | 100.0 /100 | #31 | Exceptional $44,541 |
| Immigrants | Northern Europe | 100.0 /100 | #32 | Exceptional $44,366 |
| Immigrants | Asia | 100.0 /100 | #33 | Exceptional $44,198 |