Cheyenne vs Immigrants from Panama Median Female Earnings
COMPARE
Cheyenne
Immigrants from Panama
Median Female Earnings
Median Female Earnings Comparison
Cheyenne
Immigrants from Panama
$35,673
MEDIAN FEMALE EARNINGS
0.0/ 100
METRIC RATING
294th/ 347
METRIC RANK
$39,049
MEDIAN FEMALE EARNINGS
20.6/ 100
METRIC RATING
200th/ 347
METRIC RANK
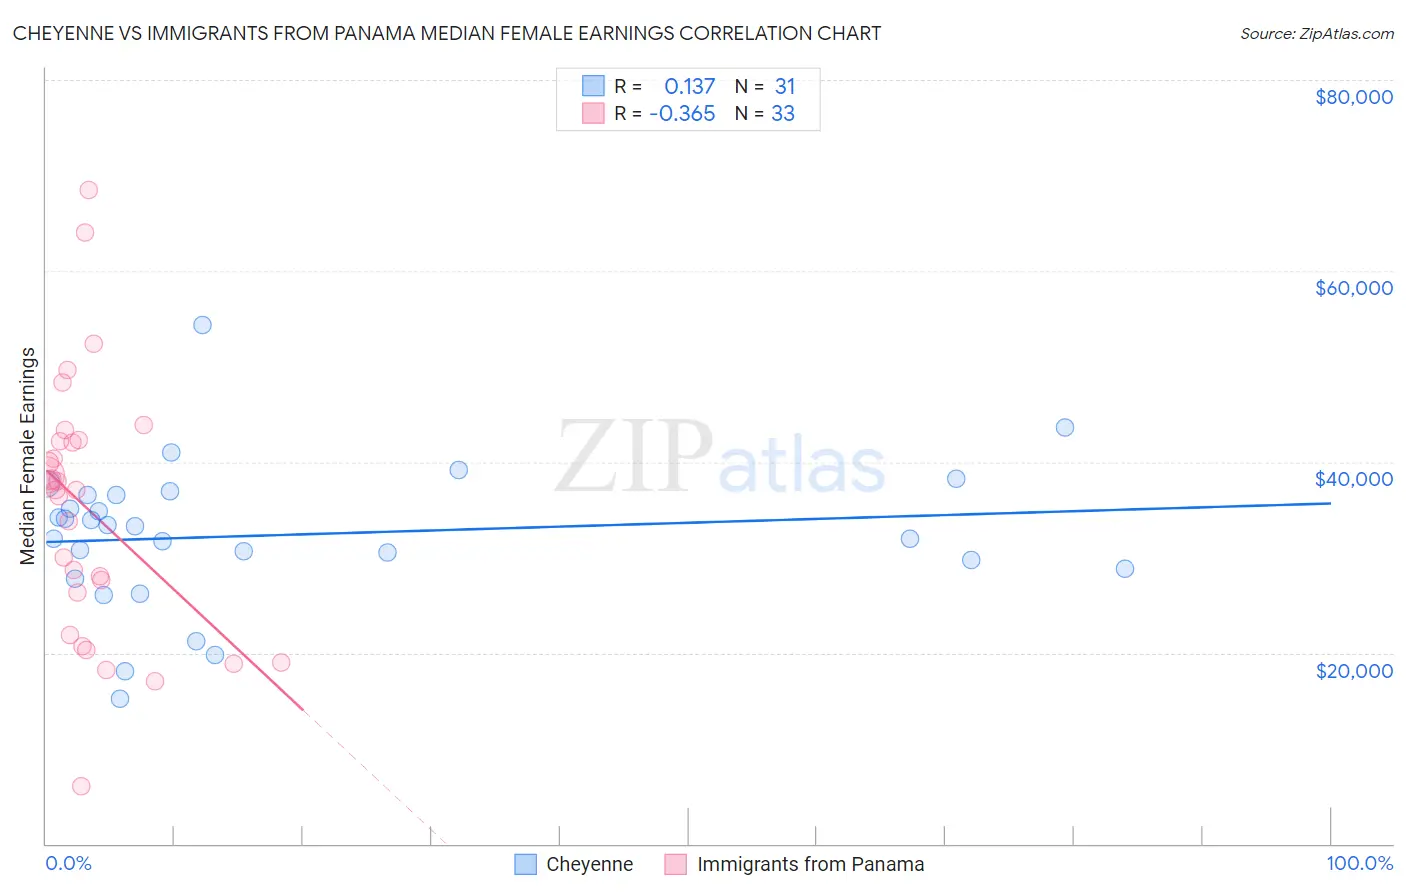
Cheyenne vs Immigrants from Panama Median Female Earnings Correlation Chart
The statistical analysis conducted on geographies consisting of 80,682,287 people shows a poor positive correlation between the proportion of Cheyenne and median female earnings in the United States with a correlation coefficient (R) of 0.137 and weighted average of $35,673. Similarly, the statistical analysis conducted on geographies consisting of 221,152,407 people shows a mild negative correlation between the proportion of Immigrants from Panama and median female earnings in the United States with a correlation coefficient (R) of -0.365 and weighted average of $39,049, a difference of 9.5%.
Median Female Earnings Correlation Summary
| Measurement | Cheyenne | Immigrants from Panama |
| Minimum | $15,218 | $6,075 |
| Maximum | $54,333 | $68,458 |
| Range | $39,115 | $62,383 |
| Mean | $32,359 | $35,051 |
| Median | $33,313 | $37,083 |
| Interquartile 25% (IQ1) | $28,775 | $24,068 |
| Interquartile 75% (IQ3) | $36,563 | $42,241 |
| Interquartile Range (IQR) | $7,788 | $18,172 |
| Standard Deviation (Sample) | $7,704 | $13,535 |
| Standard Deviation (Population) | $7,579 | $13,329 |
Similar Demographics by Median Female Earnings
Demographics Similar to Cheyenne by Median Female Earnings
In terms of median female earnings, the demographic groups most similar to Cheyenne are Comanche ($35,661, a difference of 0.030%), Guatemalan ($35,695, a difference of 0.060%), Mexican American Indian ($35,629, a difference of 0.12%), American ($35,777, a difference of 0.29%), and Hmong ($35,498, a difference of 0.49%).
| Demographics | Rating | Rank | Median Female Earnings |
| Immigrants | Nicaragua | 0.0 /100 | #287 | Tragic $36,023 |
| Immigrants | Zaire | 0.0 /100 | #288 | Tragic $36,017 |
| Bangladeshis | 0.0 /100 | #289 | Tragic $35,960 |
| Central American Indians | 0.0 /100 | #290 | Tragic $35,930 |
| Blackfeet | 0.0 /100 | #291 | Tragic $35,864 |
| Americans | 0.0 /100 | #292 | Tragic $35,777 |
| Guatemalans | 0.0 /100 | #293 | Tragic $35,695 |
| Cheyenne | 0.0 /100 | #294 | Tragic $35,673 |
| Comanche | 0.0 /100 | #295 | Tragic $35,661 |
| Mexican American Indians | 0.0 /100 | #296 | Tragic $35,629 |
| Hmong | 0.0 /100 | #297 | Tragic $35,498 |
| Immigrants | Micronesia | 0.0 /100 | #298 | Tragic $35,477 |
| Immigrants | Guatemala | 0.0 /100 | #299 | Tragic $35,444 |
| Yuman | 0.0 /100 | #300 | Tragic $35,377 |
| Pima | 0.0 /100 | #301 | Tragic $35,326 |
Demographics Similar to Immigrants from Panama by Median Female Earnings
In terms of median female earnings, the demographic groups most similar to Immigrants from Panama are Panamanian ($39,049, a difference of 0.0%), Slovak ($39,029, a difference of 0.050%), Icelander ($39,109, a difference of 0.15%), Czech ($38,992, a difference of 0.15%), and Ecuadorian ($39,117, a difference of 0.17%).
| Demographics | Rating | Rank | Median Female Earnings |
| Immigrants | Nigeria | 30.2 /100 | #193 | Fair $39,294 |
| Irish | 30.0 /100 | #194 | Fair $39,291 |
| Uruguayans | 27.3 /100 | #195 | Fair $39,228 |
| Immigrants | Costa Rica | 25.6 /100 | #196 | Fair $39,186 |
| Assyrians/Chaldeans/Syriacs | 24.6 /100 | #197 | Fair $39,159 |
| Ecuadorians | 23.0 /100 | #198 | Fair $39,117 |
| Icelanders | 22.7 /100 | #199 | Fair $39,109 |
| Immigrants | Panama | 20.6 /100 | #200 | Fair $39,049 |
| Panamanians | 20.6 /100 | #201 | Fair $39,049 |
| Slovaks | 19.9 /100 | #202 | Poor $39,029 |
| Czechs | 18.7 /100 | #203 | Poor $38,992 |
| Immigrants | Uruguay | 17.3 /100 | #204 | Poor $38,945 |
| Immigrants | Colombia | 16.3 /100 | #205 | Poor $38,913 |
| Immigrants | Bosnia and Herzegovina | 15.6 /100 | #206 | Poor $38,886 |
| Immigrants | Cambodia | 14.2 /100 | #207 | Poor $38,833 |