Cheyenne vs Venezuelan Median Female Earnings
COMPARE
Cheyenne
Venezuelan
Median Female Earnings
Median Female Earnings Comparison
Cheyenne
Venezuelans
$35,673
MEDIAN FEMALE EARNINGS
0.0/ 100
METRIC RATING
294th/ 347
METRIC RANK
$37,282
MEDIAN FEMALE EARNINGS
0.7/ 100
METRIC RATING
262nd/ 347
METRIC RANK
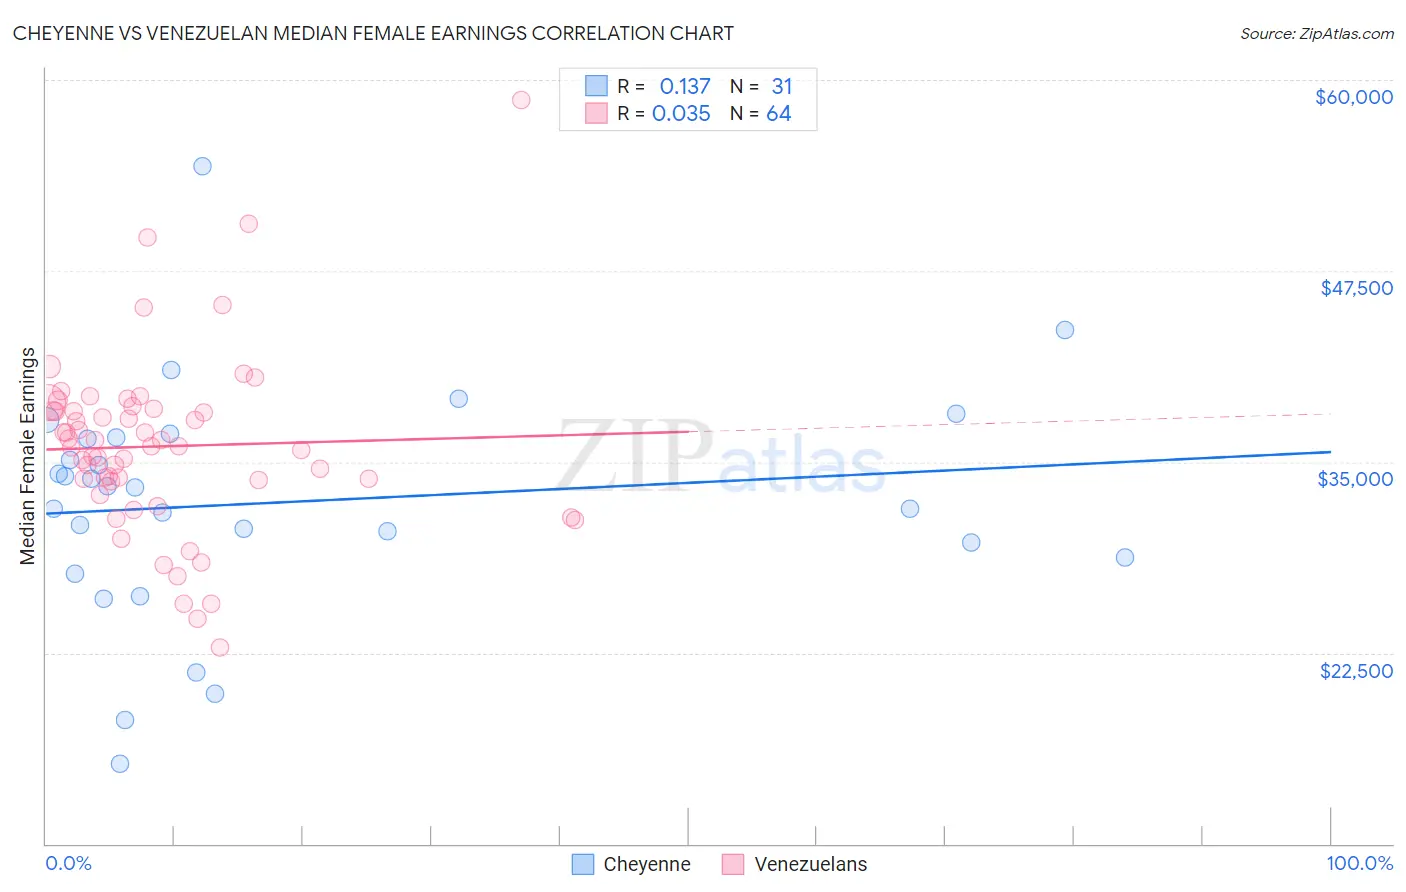
Cheyenne vs Venezuelan Median Female Earnings Correlation Chart
The statistical analysis conducted on geographies consisting of 80,682,287 people shows a poor positive correlation between the proportion of Cheyenne and median female earnings in the United States with a correlation coefficient (R) of 0.137 and weighted average of $35,673. Similarly, the statistical analysis conducted on geographies consisting of 306,258,851 people shows no correlation between the proportion of Venezuelans and median female earnings in the United States with a correlation coefficient (R) of 0.035 and weighted average of $37,282, a difference of 4.5%.
Median Female Earnings Correlation Summary
| Measurement | Cheyenne | Venezuelan |
| Minimum | $15,218 | $22,864 |
| Maximum | $54,333 | $58,709 |
| Range | $39,115 | $35,845 |
| Mean | $32,359 | $36,013 |
| Median | $33,313 | $36,008 |
| Interquartile 25% (IQ1) | $28,775 | $33,765 |
| Interquartile 75% (IQ3) | $36,563 | $38,398 |
| Interquartile Range (IQR) | $7,788 | $4,633 |
| Standard Deviation (Sample) | $7,704 | $5,910 |
| Standard Deviation (Population) | $7,579 | $5,863 |
Similar Demographics by Median Female Earnings
Demographics Similar to Cheyenne by Median Female Earnings
In terms of median female earnings, the demographic groups most similar to Cheyenne are Comanche ($35,661, a difference of 0.030%), Guatemalan ($35,695, a difference of 0.060%), Mexican American Indian ($35,629, a difference of 0.12%), American ($35,777, a difference of 0.29%), and Hmong ($35,498, a difference of 0.49%).
| Demographics | Rating | Rank | Median Female Earnings |
| Immigrants | Nicaragua | 0.0 /100 | #287 | Tragic $36,023 |
| Immigrants | Zaire | 0.0 /100 | #288 | Tragic $36,017 |
| Bangladeshis | 0.0 /100 | #289 | Tragic $35,960 |
| Central American Indians | 0.0 /100 | #290 | Tragic $35,930 |
| Blackfeet | 0.0 /100 | #291 | Tragic $35,864 |
| Americans | 0.0 /100 | #292 | Tragic $35,777 |
| Guatemalans | 0.0 /100 | #293 | Tragic $35,695 |
| Cheyenne | 0.0 /100 | #294 | Tragic $35,673 |
| Comanche | 0.0 /100 | #295 | Tragic $35,661 |
| Mexican American Indians | 0.0 /100 | #296 | Tragic $35,629 |
| Hmong | 0.0 /100 | #297 | Tragic $35,498 |
| Immigrants | Micronesia | 0.0 /100 | #298 | Tragic $35,477 |
| Immigrants | Guatemala | 0.0 /100 | #299 | Tragic $35,444 |
| Yuman | 0.0 /100 | #300 | Tragic $35,377 |
| Pima | 0.0 /100 | #301 | Tragic $35,326 |
Demographics Similar to Venezuelans by Median Female Earnings
In terms of median female earnings, the demographic groups most similar to Venezuelans are Malaysian ($37,298, a difference of 0.040%), Dutch ($37,339, a difference of 0.15%), Scotch-Irish ($37,383, a difference of 0.27%), Belizean ($37,429, a difference of 0.39%), and German Russian ($37,105, a difference of 0.48%).
| Demographics | Rating | Rank | Median Female Earnings |
| Colville | 1.1 /100 | #255 | Tragic $37,514 |
| Samoans | 1.0 /100 | #256 | Tragic $37,498 |
| Hawaiians | 1.0 /100 | #257 | Tragic $37,497 |
| Belizeans | 0.9 /100 | #258 | Tragic $37,429 |
| Scotch-Irish | 0.8 /100 | #259 | Tragic $37,383 |
| Dutch | 0.7 /100 | #260 | Tragic $37,339 |
| Malaysians | 0.7 /100 | #261 | Tragic $37,298 |
| Venezuelans | 0.7 /100 | #262 | Tragic $37,282 |
| German Russians | 0.5 /100 | #263 | Tragic $37,105 |
| Salvadorans | 0.4 /100 | #264 | Tragic $37,083 |
| Immigrants | Belize | 0.4 /100 | #265 | Tragic $37,056 |
| Dominicans | 0.4 /100 | #266 | Tragic $37,046 |
| Immigrants | Nonimmigrants | 0.4 /100 | #267 | Tragic $37,024 |
| Cree | 0.4 /100 | #268 | Tragic $37,018 |
| Immigrants | Venezuela | 0.4 /100 | #269 | Tragic $37,003 |