Swedish vs Immigrants from Thailand Median Female Earnings

COMPARE

Swedish
Race
Ancestry
AfghanAfricanAlaska NativeAlaskan AthabascanAlbanianAleutAlsatianAmericanApacheArabArapahoArgentineanArmenianAssyrian/Chaldean/SyriacAustralianAustrianBahamianBangladeshiBarbadianBasqueBelgianBelizeanBermudanBhutaneseBlackfeetBolivianBrazilianBritishBritish West IndianBulgarianBurmeseCajunCambodianCanadianCape VerdeanCarpatho RusynCelticCentral AmericanCentral American IndianCherokeeCheyenneChickasawChileanChineseChippewaChoctawColombianColvilleComancheCosta RicanCreeCreekCroatianCrowCubanCypriotCzechCzechoslovakianDanishDelawareDominicanDutchDutch West IndianEastern EuropeanEcuadorianEgyptianEnglishEstonianEthiopianEuropeanFijianFilipinoFinnishFrenchFrench American IndianFrench CanadianGermanGerman RussianGhanaianGreekGuamanian/ChamorroGuatemalanGuyaneseHaitianHmongHonduranHopiHoumaHungarianIcelanderIndian (Asian)IndonesianInupiatIranianIraqiIrishIroquoisIsraeliItalianJamaicanJapaneseJordanianKenyanKiowaKoreanLaotianLatvianLebaneseLiberianLithuanianLumbeeLuxembourgerMacedonianMalaysianMalteseMarshalleseMenomineeMexicanMexican American IndianMongolianMoroccanNative HawaiianNavajoNepaleseNew ZealanderNicaraguanNigerianNorthern EuropeanNorwegianOkinawanOsageOttawaPaiutePakistaniPalestinianPanamanianParaguayanPennsylvania GermanPeruvianPimaPolishPortuguesePotawatomiPuebloPuerto RicanPuget Sound SalishRomanianRussianSalvadoranSamoanScandinavianScotch-IrishScottishSeminoleSenegaleseSerbianShoshoneSierra LeoneanSiouxSlavicSlovakSloveneSomaliSouth AfricanSouth AmericanSouth American IndianSoviet UnionSpaniardSpanishSpanish AmericanSpanish American IndianSri LankanSubsaharan AfricanSudaneseSwedishSwissSyrianTaiwaneseThaiTlingit-HaidaTohono O'OdhamTonganTrinidadian and TobagonianTsimshianTurkishU.S. Virgin IslanderUgandanUkrainianUruguayanUteVenezuelanVietnameseWelshWest IndianYakamaYaquiYugoslavianYumanYup'ikZimbabwean
Immigration
NonimmigrantsImmigrantsAfghanistanAfricaAlbaniaArgentinaArmeniaAsiaAustraliaAustriaBahamasBangladeshBarbadosBelarusBelgiumBelizeBoliviaBosnia and HerzegovinaBrazilBulgariaBurma/MyanmarCabo VerdeCambodiaCameroonCanadaCaribbeanCentral AmericaChileChinaColombiaCongoCosta RicaCroatiaCubaCzechoslovakiaDenmarkDominicaDominican RepublicEastern AfricaEastern AsiaEastern EuropeEcuadorEgyptEl SalvadorEnglandEritreaEthiopiaEuropeFijiFranceGermanyGhanaGreeceGrenadaGuatemalaGuyanaHaitiHondurasHong KongHungaryIndiaIndonesiaIranIraqIrelandIsraelItalyJamaicaJapanJordanKazakhstanKenyaKoreaKuwaitLaosLatin AmericaLatviaLebanonLiberiaLithuaniaMalaysiaMexicoMicronesiaMiddle AfricaMoldovaMoroccoNepalNetherlandsNicaraguaNigeriaNorth AmericaNorth MacedoniaNorthern AfricaNorthern EuropeNorwayOceaniaPakistanPanamaPeruPhilippinesPolandPortugalRomaniaRussiaSaudi ArabiaScotlandSenegalSerbiaSierra LeoneSingaporeSomaliaSouth AfricaSouth AmericaSouth Central AsiaSouth Eastern AsiaSouthern EuropeSpainSri LankaSt. Vincent and the GrenadinesSudanSwedenSwitzerlandSyriaTaiwanTrinidad and TobagoTurkeyUgandaUkraineUruguayUzbekistanVenezuelaVietnamWest IndiesWestern AfricaWestern AsiaWestern EuropeYemenZaireZimbabweAzores
Immigrants from Thailand
Race
Ancestry
AfghanAfricanAlaska NativeAlaskan AthabascanAlbanianAleutAlsatianAmericanApacheArabArapahoArgentineanArmenianAssyrian/Chaldean/SyriacAustralianAustrianBahamianBangladeshiBarbadianBasqueBelgianBelizeanBermudanBhutaneseBlackfeetBolivianBrazilianBritishBritish West IndianBulgarianBurmeseCajunCambodianCanadianCape VerdeanCarpatho RusynCelticCentral AmericanCentral American IndianCherokeeCheyenneChickasawChileanChineseChippewaChoctawColombianColvilleComancheCosta RicanCreeCreekCroatianCrowCubanCypriotCzechCzechoslovakianDanishDelawareDominicanDutchDutch West IndianEastern EuropeanEcuadorianEgyptianEnglishEstonianEthiopianEuropeanFijianFilipinoFinnishFrenchFrench American IndianFrench CanadianGermanGerman RussianGhanaianGreekGuamanian/ChamorroGuatemalanGuyaneseHaitianHmongHonduranHopiHoumaHungarianIcelanderIndian (Asian)IndonesianInupiatIranianIraqiIrishIroquoisIsraeliItalianJamaicanJapaneseJordanianKenyanKiowaKoreanLaotianLatvianLebaneseLiberianLithuanianLumbeeLuxembourgerMacedonianMalaysianMalteseMarshalleseMenomineeMexicanMexican American IndianMongolianMoroccanNative HawaiianNavajoNepaleseNew ZealanderNicaraguanNigerianNorthern EuropeanNorwegianOkinawanOsageOttawaPaiutePakistaniPalestinianPanamanianParaguayanPennsylvania GermanPeruvianPimaPolishPortuguesePotawatomiPuebloPuerto RicanPuget Sound SalishRomanianRussianSalvadoranSamoanScandinavianScotch-IrishScottishSeminoleSenegaleseSerbianShoshoneSierra LeoneanSiouxSlavicSlovakSloveneSomaliSouth AfricanSouth AmericanSouth American IndianSoviet UnionSpaniardSpanishSpanish AmericanSpanish American IndianSri LankanSubsaharan AfricanSudaneseSwissSyrianTaiwaneseThaiTlingit-HaidaTohono O'OdhamTonganTrinidadian and TobagonianTsimshianTurkishU.S. Virgin IslanderUgandanUkrainianUruguayanUteVenezuelanVietnameseWelshWest IndianYakamaYaquiYugoslavianYumanYup'ikZimbabwean
Immigration
NonimmigrantsImmigrantsAfghanistanAfricaAlbaniaArgentinaArmeniaAsiaAustraliaAustriaBahamasBangladeshBarbadosBelarusBelgiumBelizeBoliviaBosnia and HerzegovinaBrazilBulgariaBurma/MyanmarCabo VerdeCambodiaCameroonCanadaCaribbeanCentral AmericaChileChinaColombiaCongoCosta RicaCroatiaCubaCzechoslovakiaDenmarkDominicaDominican RepublicEastern AfricaEastern AsiaEastern EuropeEcuadorEgyptEl SalvadorEnglandEritreaEthiopiaEuropeFijiFranceGermanyGhanaGreeceGrenadaGuatemalaGuyanaHaitiHondurasHong KongHungaryIndiaIndonesiaIranIraqIrelandIsraelItalyJamaicaJapanJordanKazakhstanKenyaKoreaKuwaitLaosLatin AmericaLatviaLebanonLiberiaLithuaniaMalaysiaMexicoMicronesiaMiddle AfricaMoldovaMoroccoNepalNetherlandsNicaraguaNigeriaNorth AmericaNorth MacedoniaNorthern AfricaNorthern EuropeNorwayOceaniaPakistanPanamaPeruPhilippinesPolandPortugalRomaniaRussiaSaudi ArabiaScotlandSenegalSerbiaSierra LeoneSingaporeSomaliaSouth AfricaSouth AmericaSouth Central AsiaSouth Eastern AsiaSouthern EuropeSpainSri LankaSt. Vincent and the GrenadinesSudanSwedenSwitzerlandSyriaTaiwanThailandTrinidad and TobagoTurkeyUgandaUkraineUruguayUzbekistanVenezuelaVietnamWest IndiesWestern AfricaWestern AsiaWestern EuropeYemenZaireZimbabweAzores
Median Female Earnings
Income
Poverty
Unemployment
Labor Participation
Family Structure
Vehicle Availability
Education Level
Disability

Median Female Earnings Comparison

Swedes

Immigrants from Thailand

Fair
Poor
$39,421
MEDIAN FEMALE EARNINGS
36.0/ 100
METRIC RATING
187th/ 347
METRIC RANK
$38,810
MEDIAN FEMALE EARNINGS
13.6/ 100
METRIC RATING
208th/ 347
METRIC RANK

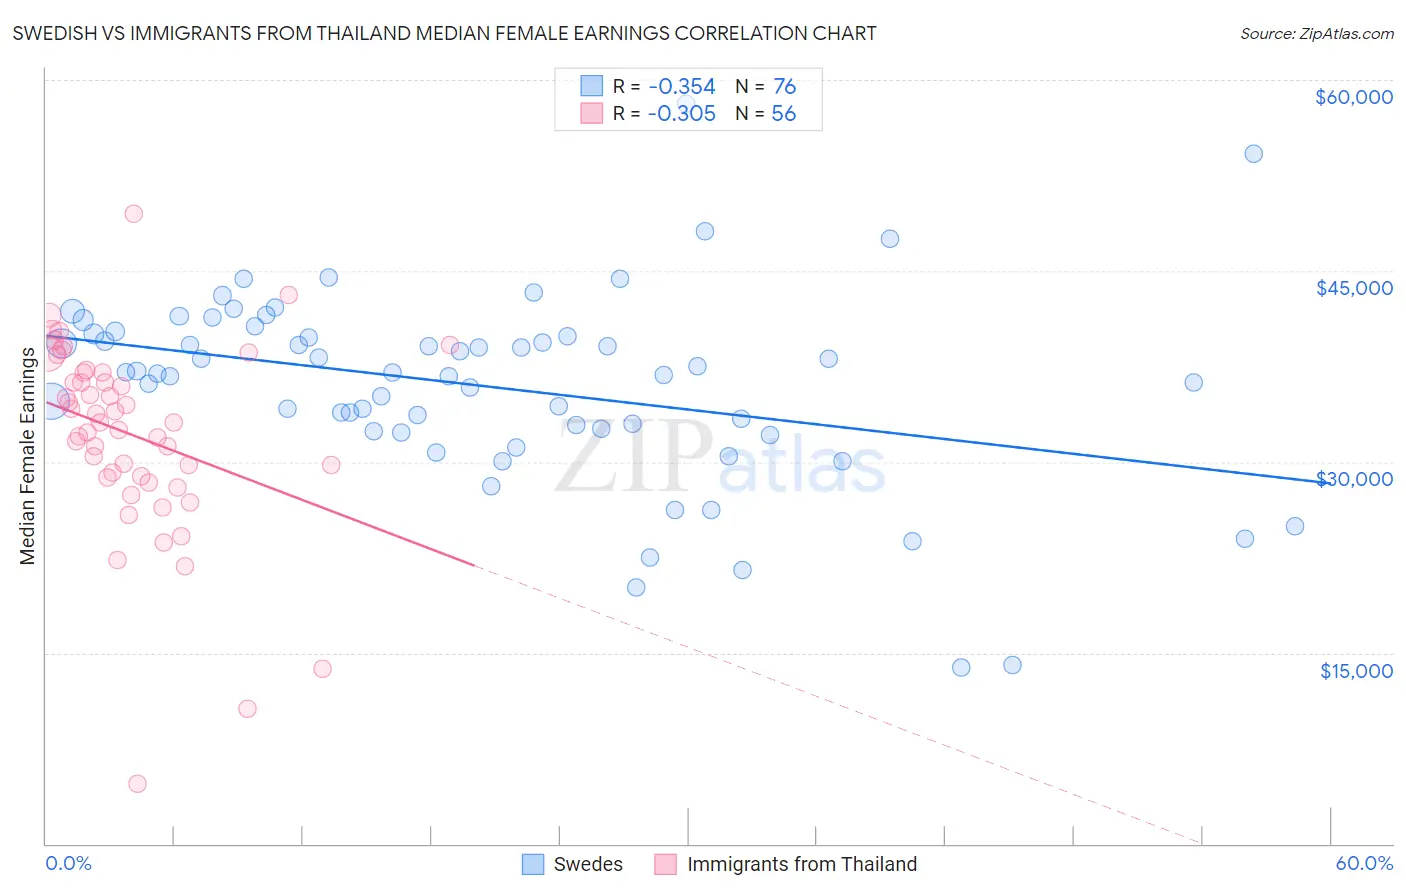
Swedish vs Immigrants from Thailand Median Female Earnings Correlation Chart

The statistical analysis conducted on geographies consisting of 538,112,894 people shows a mild negative correlation between the proportion of Swedes and median female earnings in the United States with a correlation coefficient (R) of -0.354 and weighted average of $39,421. Similarly, the statistical analysis conducted on geographies consisting of 316,955,247 people shows a mild negative correlation between the proportion of Immigrants from Thailand and median female earnings in the United States with a correlation coefficient (R) of -0.305 and weighted average of $38,810, a difference of 1.6%.
Swedish vs Immigrants from Thailand Median Female Earnings

Median Female Earnings Correlation Summary

MeasurementSwedishImmigrants from Thailand
Minimum$13,839$4,682
Maximum$58,087$49,527
Range$44,248$44,845
Mean$35,925$32,114
Median$36,993$33,058
Interquartile 25% (IQ1)$32,470$28,829
Interquartile 75% (IQ3)$39,982$37,011
Interquartile Range (IQR)$7,512$8,182
Standard Deviation (Sample)$7,648$7,697
Standard Deviation (Population)$7,597$7,628

Similar Demographics by Median Female Earnings

Demographics Similar to Swedes by Median Female Earnings

In terms of median female earnings, the demographic groups most similar to Swedes are Bermudan ($39,418, a difference of 0.010%), Immigrants from West Indies ($39,441, a difference of 0.050%), Colombian ($39,439, a difference of 0.050%), European ($39,457, a difference of 0.090%), and Senegalese ($39,384, a difference of 0.090%).
DemographicsRating | RankMedian Female Earnings
Immigrants | Kenya
41.6
/100
|
#180
Average
$39,535
Tsimshian
41.4
/100
|
#181
Average
$39,530
Tlingit-Haida
40.5
/100
|
#182
Average
$39,513
Hungarians
40.3
/100
|
#183
Average
$39,510
Europeans
37.7
/100
|
#184
Fair
$39,457
Immigrants | West Indies
36.9
/100
|
#185
Fair
$39,441
Colombians
36.9
/100
|
#186
Fair
$39,439
Swedes
36.0
/100
|
#187
Fair
$39,421
Bermudans
35.9
/100
|
#188
Fair
$39,418
Senegalese
34.2
/100
|
#189
Fair
$39,384
Puget Sound Salish
33.9
/100
|
#190
Fair
$39,376
Immigrants | Western Africa
32.7
/100
|
#191
Fair
$39,351
Immigrants | Immigrants
31.7
/100
|
#192
Fair
$39,328
Immigrants | Nigeria
30.2
/100
|
#193
Fair
$39,294
Irish
30.0
/100
|
#194
Fair
$39,291

Demographics Similar to Immigrants from Thailand by Median Female Earnings

In terms of median female earnings, the demographic groups most similar to Immigrants from Thailand are Norwegian ($38,802, a difference of 0.020%), Immigrants from Cambodia ($38,833, a difference of 0.060%), Czechoslovakian ($38,738, a difference of 0.19%), Immigrants from Bosnia and Herzegovina ($38,886, a difference of 0.20%), and Aleut ($38,719, a difference of 0.23%).
DemographicsRating | RankMedian Female Earnings
Panamanians
20.6
/100
|
#201
Fair
$39,049
Slovaks
19.9
/100
|
#202
Poor
$39,029
Czechs
18.7
/100
|
#203
Poor
$38,992
Immigrants | Uruguay
17.3
/100
|
#204
Poor
$38,945
Immigrants | Colombia
16.3
/100
|
#205
Poor
$38,913
Immigrants | Bosnia and Herzegovina
15.6
/100
|
#206
Poor
$38,886
Immigrants | Cambodia
14.2
/100
|
#207
Poor
$38,833
Immigrants | Thailand
13.6
/100
|
#208
Poor
$38,810
Norwegians
13.4
/100
|
#209
Poor
$38,802
Czechoslovakians
12.0
/100
|
#210
Poor
$38,738
Aleuts
11.6
/100
|
#211
Poor
$38,719
Guamanians/Chamorros
11.5
/100
|
#212
Poor
$38,717
Jamaicans
10.5
/100
|
#213
Poor
$38,670
Iraqis
10.5
/100
|
#214
Poor
$38,666
Spaniards
10.3
/100
|
#215
Poor
$38,656