Alsatian vs Immigrants from Thailand Median Female Earnings
COMPARE
Alsatian
Immigrants from Thailand
Median Female Earnings
Median Female Earnings Comparison
Alsatians
Immigrants from Thailand
$40,060
MEDIAN FEMALE EARNINGS
68.0/ 100
METRIC RATING
161st/ 347
METRIC RANK
$38,810
MEDIAN FEMALE EARNINGS
13.6/ 100
METRIC RATING
208th/ 347
METRIC RANK
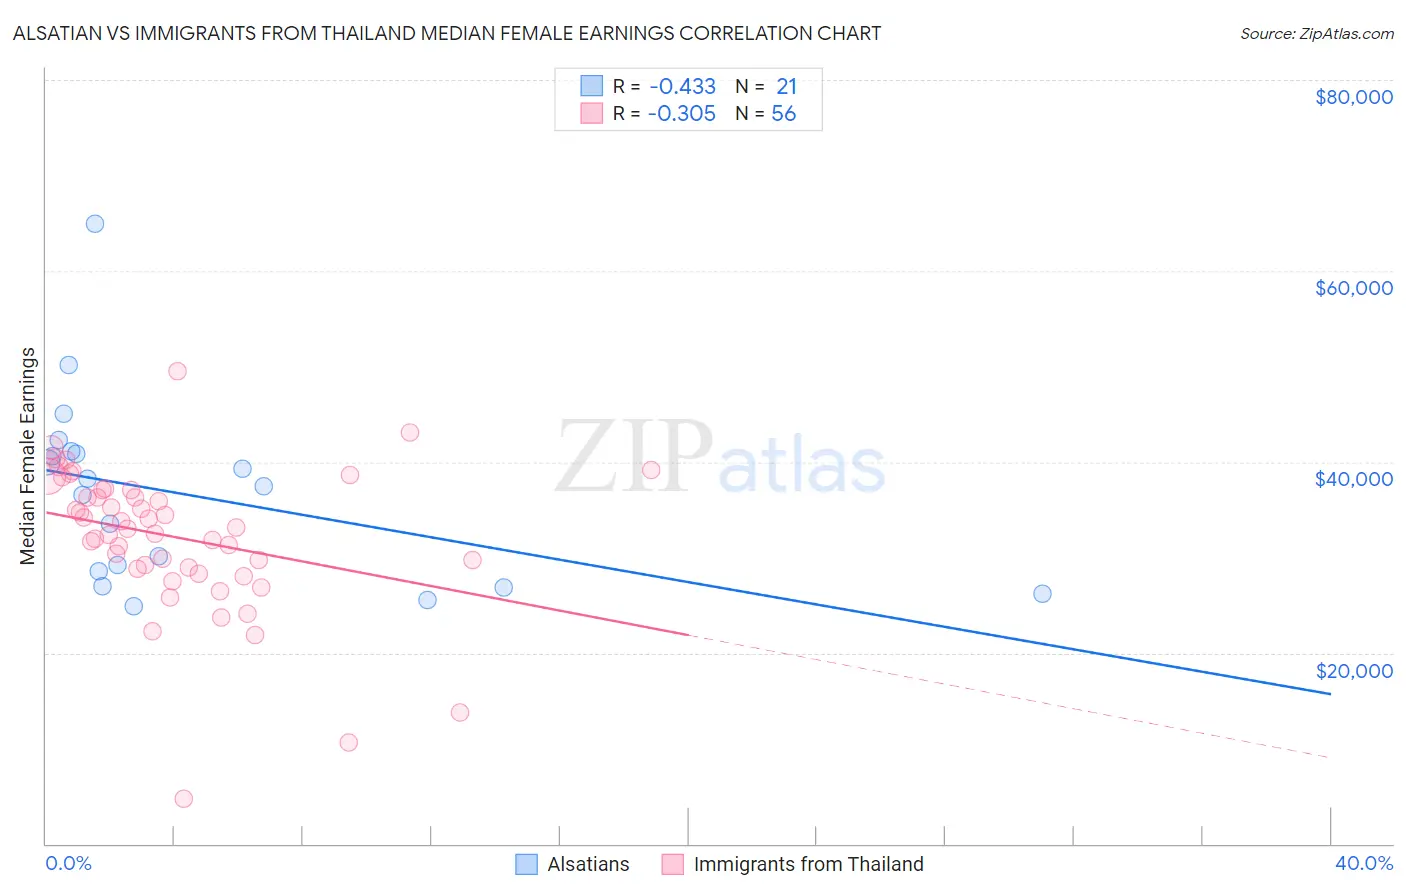
Alsatian vs Immigrants from Thailand Median Female Earnings Correlation Chart
The statistical analysis conducted on geographies consisting of 82,671,266 people shows a moderate negative correlation between the proportion of Alsatians and median female earnings in the United States with a correlation coefficient (R) of -0.433 and weighted average of $40,060. Similarly, the statistical analysis conducted on geographies consisting of 316,955,247 people shows a mild negative correlation between the proportion of Immigrants from Thailand and median female earnings in the United States with a correlation coefficient (R) of -0.305 and weighted average of $38,810, a difference of 3.2%.
Median Female Earnings Correlation Summary
| Measurement | Alsatian | Immigrants from Thailand |
| Minimum | $24,833 | $4,682 |
| Maximum | $65,000 | $49,527 |
| Range | $40,167 | $44,845 |
| Mean | $36,577 | $32,114 |
| Median | $37,425 | $33,058 |
| Interquartile 25% (IQ1) | $27,720 | $28,829 |
| Interquartile 75% (IQ3) | $40,989 | $37,011 |
| Interquartile Range (IQR) | $13,268 | $8,182 |
| Standard Deviation (Sample) | $9,753 | $7,697 |
| Standard Deviation (Population) | $9,518 | $7,628 |
Similar Demographics by Median Female Earnings
Demographics Similar to Alsatians by Median Female Earnings
In terms of median female earnings, the demographic groups most similar to Alsatians are Inupiat ($40,080, a difference of 0.050%), South American Indian ($40,019, a difference of 0.10%), Lebanese ($40,006, a difference of 0.14%), Immigrants from Vietnam ($40,153, a difference of 0.23%), and Immigrants from Senegal ($40,157, a difference of 0.24%).
| Demographics | Rating | Rank | Median Female Earnings |
| Immigrants | Oceania | 77.6 /100 | #154 | Good $40,297 |
| Immigrants | Africa | 76.2 /100 | #155 | Good $40,257 |
| Peruvians | 75.3 /100 | #156 | Good $40,234 |
| Portuguese | 73.0 /100 | #157 | Good $40,177 |
| Immigrants | Senegal | 72.2 /100 | #158 | Good $40,157 |
| Immigrants | Vietnam | 72.0 /100 | #159 | Good $40,153 |
| Inupiat | 68.9 /100 | #160 | Good $40,080 |
| Alsatians | 68.0 /100 | #161 | Good $40,060 |
| South American Indians | 66.1 /100 | #162 | Good $40,019 |
| Lebanese | 65.5 /100 | #163 | Good $40,006 |
| Immigrants | Saudi Arabia | 62.9 /100 | #164 | Good $39,952 |
| Immigrants | Bangladesh | 60.8 /100 | #165 | Good $39,910 |
| Immigrants | Ghana | 60.0 /100 | #166 | Good $39,894 |
| Luxembourgers | 59.9 /100 | #167 | Average $39,891 |
| Immigrants | Peru | 58.9 /100 | #168 | Average $39,871 |
Demographics Similar to Immigrants from Thailand by Median Female Earnings
In terms of median female earnings, the demographic groups most similar to Immigrants from Thailand are Norwegian ($38,802, a difference of 0.020%), Immigrants from Cambodia ($38,833, a difference of 0.060%), Czechoslovakian ($38,738, a difference of 0.19%), Immigrants from Bosnia and Herzegovina ($38,886, a difference of 0.20%), and Aleut ($38,719, a difference of 0.23%).
| Demographics | Rating | Rank | Median Female Earnings |
| Panamanians | 20.6 /100 | #201 | Fair $39,049 |
| Slovaks | 19.9 /100 | #202 | Poor $39,029 |
| Czechs | 18.7 /100 | #203 | Poor $38,992 |
| Immigrants | Uruguay | 17.3 /100 | #204 | Poor $38,945 |
| Immigrants | Colombia | 16.3 /100 | #205 | Poor $38,913 |
| Immigrants | Bosnia and Herzegovina | 15.6 /100 | #206 | Poor $38,886 |
| Immigrants | Cambodia | 14.2 /100 | #207 | Poor $38,833 |
| Immigrants | Thailand | 13.6 /100 | #208 | Poor $38,810 |
| Norwegians | 13.4 /100 | #209 | Poor $38,802 |
| Czechoslovakians | 12.0 /100 | #210 | Poor $38,738 |
| Aleuts | 11.6 /100 | #211 | Poor $38,719 |
| Guamanians/Chamorros | 11.5 /100 | #212 | Poor $38,717 |
| Jamaicans | 10.5 /100 | #213 | Poor $38,670 |
| Iraqis | 10.5 /100 | #214 | Poor $38,666 |
| Spaniards | 10.3 /100 | #215 | Poor $38,656 |