Cheyenne vs Immigrants from Thailand Nursery School
COMPARE
Cheyenne
Immigrants from Thailand
Nursery School
Nursery School Comparison
Cheyenne
Immigrants from Thailand
98.4%
NURSERY SCHOOL
99.6/ 100
METRIC RATING
70th/ 347
METRIC RANK
97.3%
NURSERY SCHOOL
0.0/ 100
METRIC RATING
288th/ 347
METRIC RANK
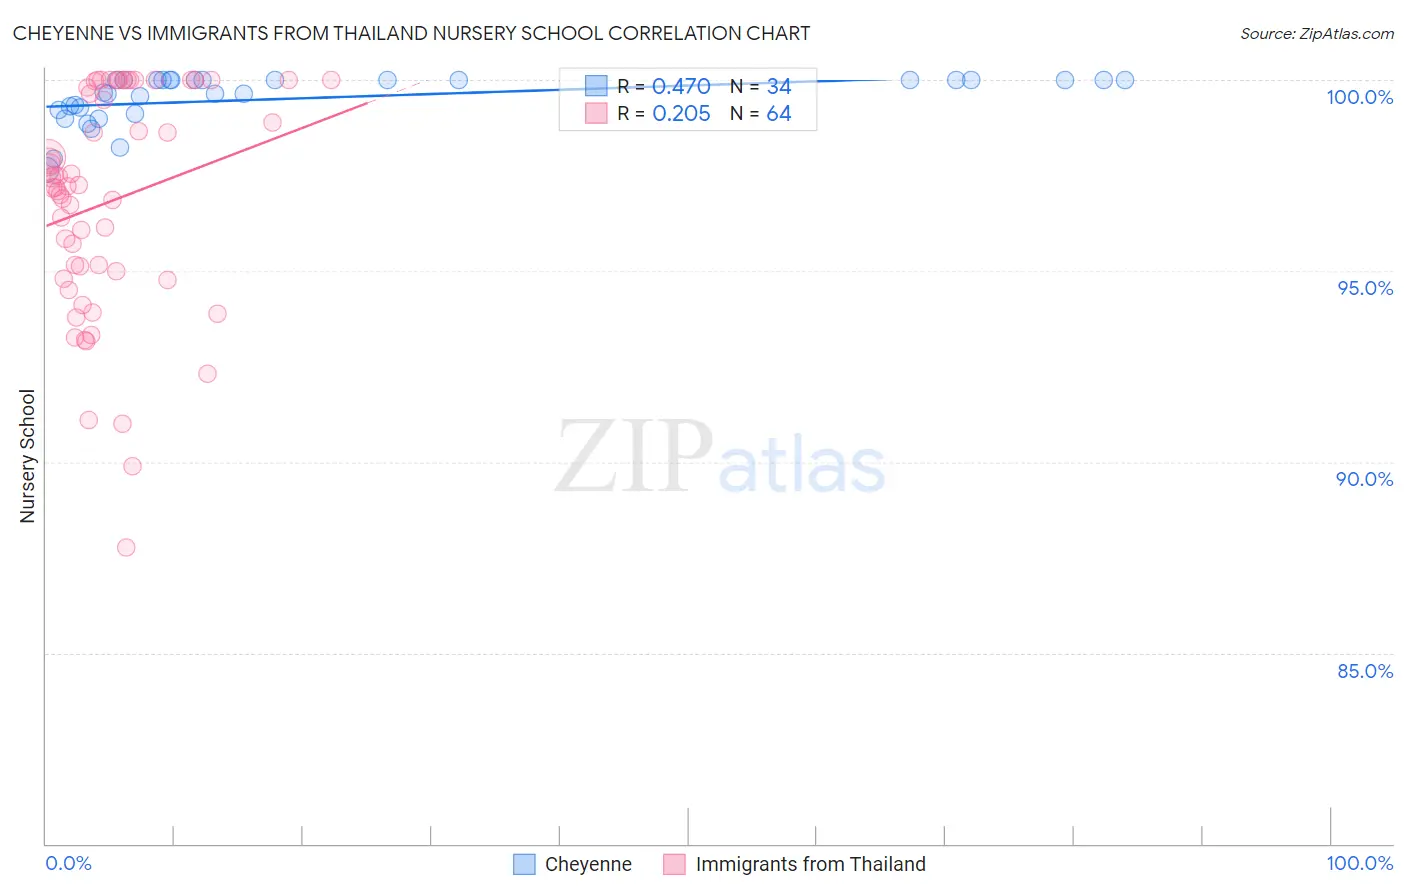
Cheyenne vs Immigrants from Thailand Nursery School Correlation Chart
The statistical analysis conducted on geographies consisting of 80,719,411 people shows a moderate positive correlation between the proportion of Cheyenne and percentage of population with at least nursery school education in the United States with a correlation coefficient (R) of 0.470 and weighted average of 98.4%. Similarly, the statistical analysis conducted on geographies consisting of 317,003,357 people shows a weak positive correlation between the proportion of Immigrants from Thailand and percentage of population with at least nursery school education in the United States with a correlation coefficient (R) of 0.205 and weighted average of 97.3%, a difference of 1.1%.
Nursery School Correlation Summary
| Measurement | Cheyenne | Immigrants from Thailand |
| Minimum | 97.7% | 87.7% |
| Maximum | 100.0% | 100.0% |
| Range | 2.3% | 12.3% |
| Mean | 99.5% | 96.8% |
| Median | 99.8% | 97.2% |
| Interquartile 25% (IQ1) | 99.2% | 94.9% |
| Interquartile 75% (IQ3) | 100.0% | 99.9% |
| Interquartile Range (IQR) | 0.79% | 5.0% |
| Standard Deviation (Sample) | 0.64% | 2.9% |
| Standard Deviation (Population) | 0.63% | 2.9% |
Similar Demographics by Nursery School
Demographics Similar to Cheyenne by Nursery School
In terms of nursery school, the demographic groups most similar to Cheyenne are Immigrants from Northern Europe (98.4%, a difference of 0.0%), Russian (98.4%, a difference of 0.0%), Immigrants from Austria (98.4%, a difference of 0.0%), Serbian (98.4%, a difference of 0.0%), and Canadian (98.4%, a difference of 0.010%).
| Demographics | Rating | Rank | Nursery School |
| Immigrants | North America | 99.7 /100 | #63 | Exceptional 98.4% |
| Greeks | 99.7 /100 | #64 | Exceptional 98.4% |
| Maltese | 99.7 /100 | #65 | Exceptional 98.4% |
| Canadians | 99.7 /100 | #66 | Exceptional 98.4% |
| Immigrants | Northern Europe | 99.6 /100 | #67 | Exceptional 98.4% |
| Russians | 99.6 /100 | #68 | Exceptional 98.4% |
| Immigrants | Austria | 99.6 /100 | #69 | Exceptional 98.4% |
| Cheyenne | 99.6 /100 | #70 | Exceptional 98.4% |
| Serbians | 99.6 /100 | #71 | Exceptional 98.4% |
| Chickasaw | 99.6 /100 | #72 | Exceptional 98.4% |
| Cajuns | 99.4 /100 | #73 | Exceptional 98.4% |
| Immigrants | Netherlands | 99.4 /100 | #74 | Exceptional 98.4% |
| Cherokee | 99.3 /100 | #75 | Exceptional 98.3% |
| Immigrants | England | 99.3 /100 | #76 | Exceptional 98.3% |
| Immigrants | Lithuania | 99.3 /100 | #77 | Exceptional 98.3% |
Demographics Similar to Immigrants from Thailand by Nursery School
In terms of nursery school, the demographic groups most similar to Immigrants from Thailand are Immigrants from St. Vincent and the Grenadines (97.3%, a difference of 0.010%), Immigrants from Afghanistan (97.3%, a difference of 0.010%), Immigrants from Portugal (97.4%, a difference of 0.020%), Immigrants from Hong Kong (97.4%, a difference of 0.020%), and Immigrants from Barbados (97.4%, a difference of 0.030%).
| Demographics | Rating | Rank | Nursery School |
| Trinidadians and Tobagonians | 0.0 /100 | #281 | Tragic 97.4% |
| Afghans | 0.0 /100 | #282 | Tragic 97.4% |
| Immigrants | West Indies | 0.0 /100 | #283 | Tragic 97.4% |
| Immigrants | Trinidad and Tobago | 0.0 /100 | #284 | Tragic 97.4% |
| Immigrants | Barbados | 0.0 /100 | #285 | Tragic 97.4% |
| Immigrants | Portugal | 0.0 /100 | #286 | Tragic 97.4% |
| Immigrants | Hong Kong | 0.0 /100 | #287 | Tragic 97.4% |
| Immigrants | Thailand | 0.0 /100 | #288 | Tragic 97.3% |
| Immigrants | St. Vincent and the Grenadines | 0.0 /100 | #289 | Tragic 97.3% |
| Immigrants | Afghanistan | 0.0 /100 | #290 | Tragic 97.3% |
| British West Indians | 0.0 /100 | #291 | Tragic 97.3% |
| Houma | 0.0 /100 | #292 | Tragic 97.3% |
| Malaysians | 0.0 /100 | #293 | Tragic 97.3% |
| Immigrants | Grenada | 0.0 /100 | #294 | Tragic 97.3% |
| Immigrants | Immigrants | 0.0 /100 | #295 | Tragic 97.2% |