Cheyenne vs Seminole Median Female Earnings
COMPARE
Cheyenne
Seminole
Median Female Earnings
Median Female Earnings Comparison
Cheyenne
Seminole
$35,673
MEDIAN FEMALE EARNINGS
0.0/ 100
METRIC RATING
294th/ 347
METRIC RANK
$34,385
MEDIAN FEMALE EARNINGS
0.0/ 100
METRIC RATING
323rd/ 347
METRIC RANK
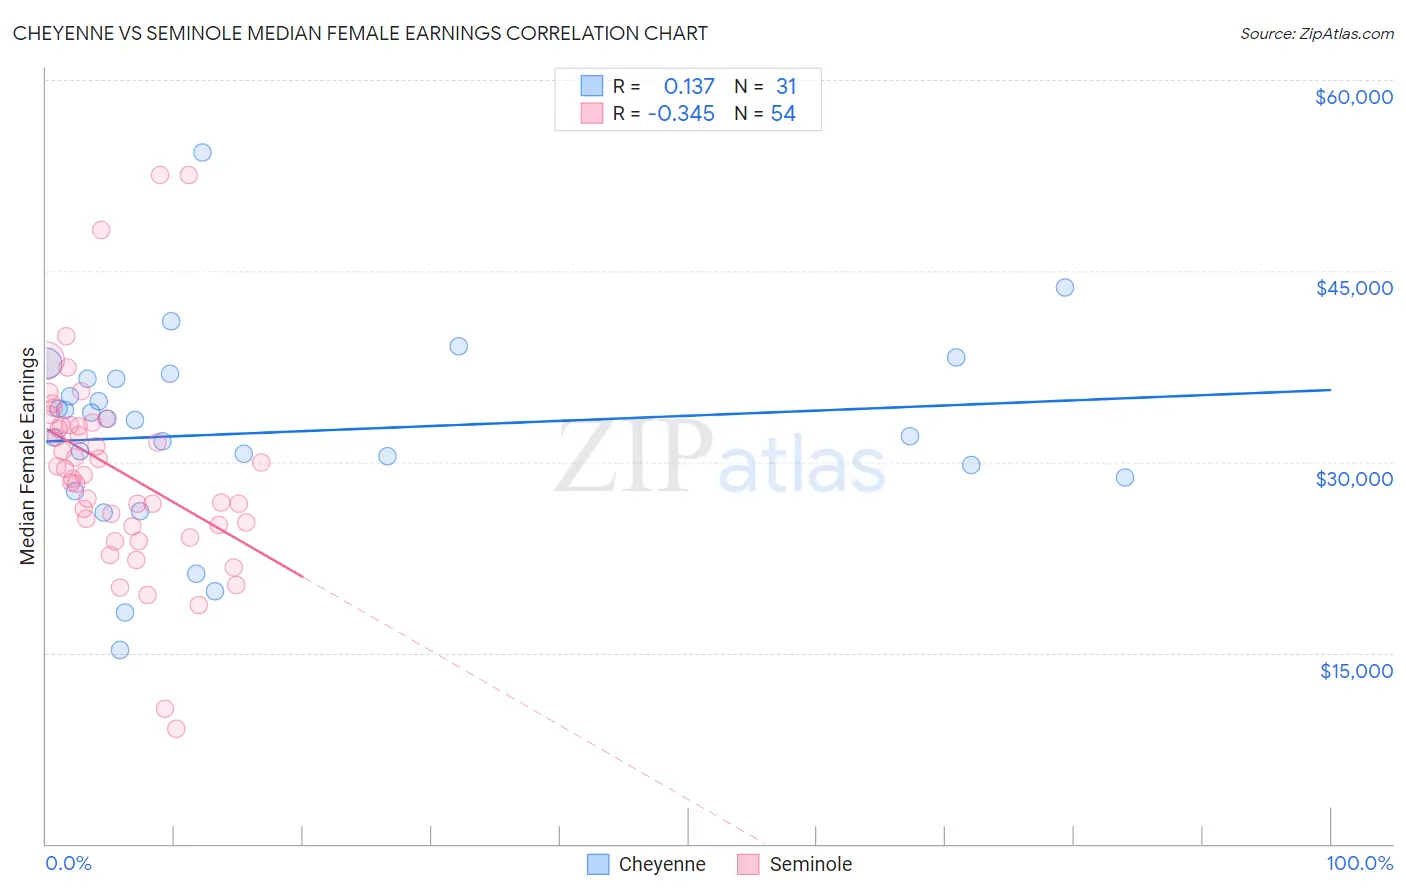
Cheyenne vs Seminole Median Female Earnings Correlation Chart
The statistical analysis conducted on geographies consisting of 80,682,287 people shows a poor positive correlation between the proportion of Cheyenne and median female earnings in the United States with a correlation coefficient (R) of 0.137 and weighted average of $35,673. Similarly, the statistical analysis conducted on geographies consisting of 118,266,998 people shows a mild negative correlation between the proportion of Seminole and median female earnings in the United States with a correlation coefficient (R) of -0.345 and weighted average of $34,385, a difference of 3.7%.
Median Female Earnings Correlation Summary
| Measurement | Cheyenne | Seminole |
| Minimum | $15,218 | $9,041 |
| Maximum | $54,333 | $52,528 |
| Range | $39,115 | $43,487 |
| Mean | $32,359 | $29,347 |
| Median | $33,313 | $29,210 |
| Interquartile 25% (IQ1) | $28,775 | $25,000 |
| Interquartile 75% (IQ3) | $36,563 | $32,861 |
| Interquartile Range (IQR) | $7,788 | $7,861 |
| Standard Deviation (Sample) | $7,704 | $8,052 |
| Standard Deviation (Population) | $7,579 | $7,977 |
Similar Demographics by Median Female Earnings
Demographics Similar to Cheyenne by Median Female Earnings
In terms of median female earnings, the demographic groups most similar to Cheyenne are Comanche ($35,661, a difference of 0.030%), Guatemalan ($35,695, a difference of 0.060%), Mexican American Indian ($35,629, a difference of 0.12%), American ($35,777, a difference of 0.29%), and Hmong ($35,498, a difference of 0.49%).
| Demographics | Rating | Rank | Median Female Earnings |
| Immigrants | Nicaragua | 0.0 /100 | #287 | Tragic $36,023 |
| Immigrants | Zaire | 0.0 /100 | #288 | Tragic $36,017 |
| Bangladeshis | 0.0 /100 | #289 | Tragic $35,960 |
| Central American Indians | 0.0 /100 | #290 | Tragic $35,930 |
| Blackfeet | 0.0 /100 | #291 | Tragic $35,864 |
| Americans | 0.0 /100 | #292 | Tragic $35,777 |
| Guatemalans | 0.0 /100 | #293 | Tragic $35,695 |
| Cheyenne | 0.0 /100 | #294 | Tragic $35,673 |
| Comanche | 0.0 /100 | #295 | Tragic $35,661 |
| Mexican American Indians | 0.0 /100 | #296 | Tragic $35,629 |
| Hmong | 0.0 /100 | #297 | Tragic $35,498 |
| Immigrants | Micronesia | 0.0 /100 | #298 | Tragic $35,477 |
| Immigrants | Guatemala | 0.0 /100 | #299 | Tragic $35,444 |
| Yuman | 0.0 /100 | #300 | Tragic $35,377 |
| Pima | 0.0 /100 | #301 | Tragic $35,326 |
Demographics Similar to Seminole by Median Female Earnings
In terms of median female earnings, the demographic groups most similar to Seminole are Chickasaw ($34,414, a difference of 0.080%), Hispanic or Latino ($34,421, a difference of 0.11%), Immigrants from Congo ($34,317, a difference of 0.20%), Immigrants from Honduras ($34,647, a difference of 0.76%), and Dutch West Indian ($34,106, a difference of 0.82%).
| Demographics | Rating | Rank | Median Female Earnings |
| Cherokee | 0.0 /100 | #316 | Tragic $34,742 |
| Potawatomi | 0.0 /100 | #317 | Tragic $34,739 |
| Immigrants | Yemen | 0.0 /100 | #318 | Tragic $34,693 |
| Shoshone | 0.0 /100 | #319 | Tragic $34,677 |
| Immigrants | Honduras | 0.0 /100 | #320 | Tragic $34,647 |
| Hispanics or Latinos | 0.0 /100 | #321 | Tragic $34,421 |
| Chickasaw | 0.0 /100 | #322 | Tragic $34,414 |
| Seminole | 0.0 /100 | #323 | Tragic $34,385 |
| Immigrants | Congo | 0.0 /100 | #324 | Tragic $34,317 |
| Dutch West Indians | 0.0 /100 | #325 | Tragic $34,106 |
| Kiowa | 0.0 /100 | #326 | Tragic $34,074 |
| Cajuns | 0.0 /100 | #327 | Tragic $34,034 |
| Immigrants | Central America | 0.0 /100 | #328 | Tragic $33,953 |
| Hopi | 0.0 /100 | #329 | Tragic $33,932 |
| Menominee | 0.0 /100 | #330 | Tragic $33,894 |