French American Indian vs Immigrants from Thailand Median Female Earnings
COMPARE
French American Indian
Immigrants from Thailand
Median Female Earnings
Median Female Earnings Comparison
French American Indians
Immigrants from Thailand
$36,920
MEDIAN FEMALE EARNINGS
0.3/ 100
METRIC RATING
270th/ 347
METRIC RANK
$38,810
MEDIAN FEMALE EARNINGS
13.6/ 100
METRIC RATING
208th/ 347
METRIC RANK
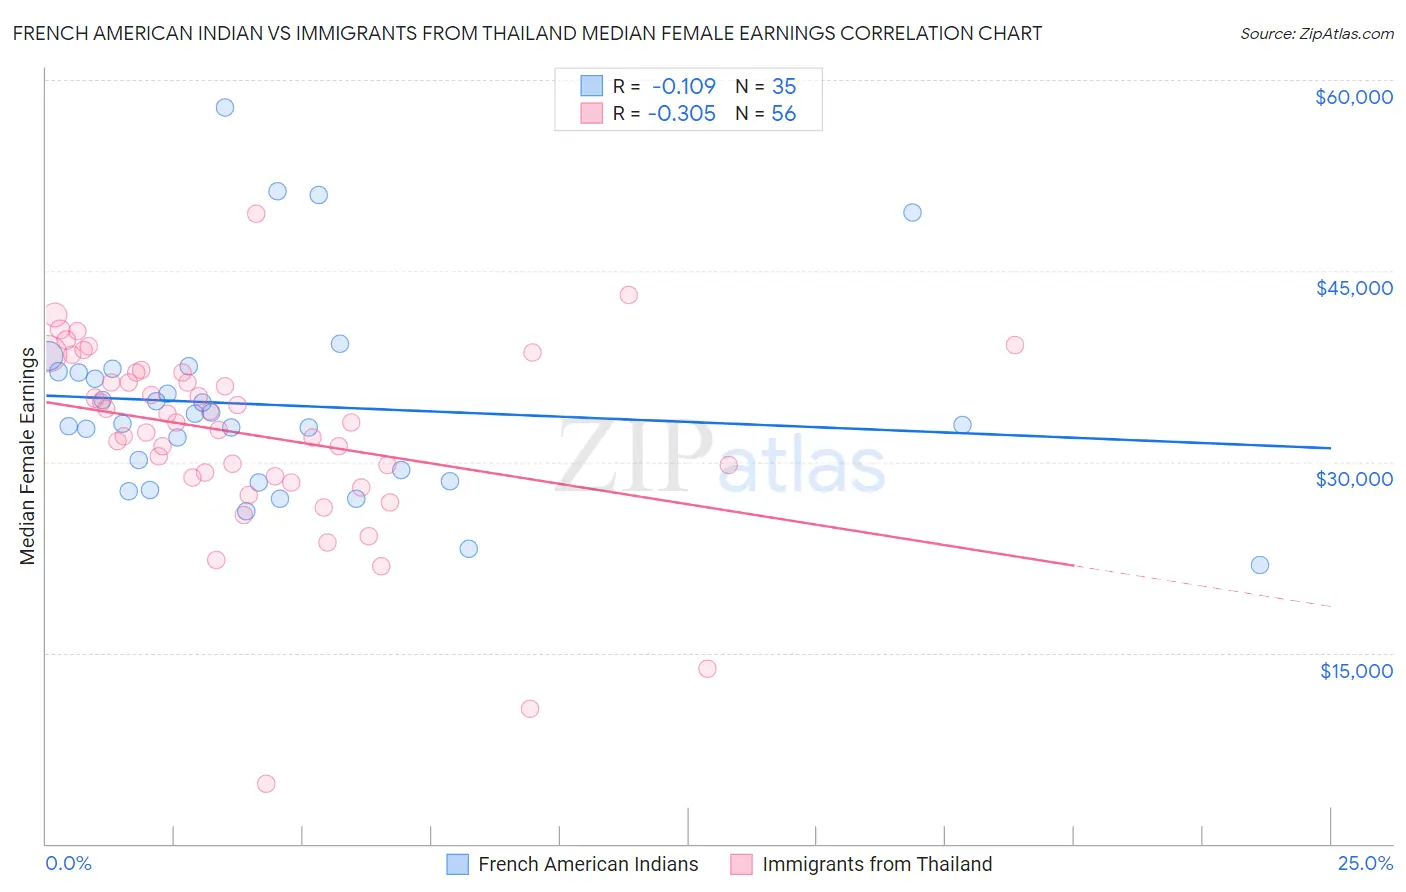
French American Indian vs Immigrants from Thailand Median Female Earnings Correlation Chart
The statistical analysis conducted on geographies consisting of 131,945,906 people shows a poor negative correlation between the proportion of French American Indians and median female earnings in the United States with a correlation coefficient (R) of -0.109 and weighted average of $36,920. Similarly, the statistical analysis conducted on geographies consisting of 316,955,247 people shows a mild negative correlation between the proportion of Immigrants from Thailand and median female earnings in the United States with a correlation coefficient (R) of -0.305 and weighted average of $38,810, a difference of 5.1%.
Median Female Earnings Correlation Summary
| Measurement | French American Indian | Immigrants from Thailand |
| Minimum | $21,875 | $4,682 |
| Maximum | $57,813 | $49,527 |
| Range | $35,938 | $44,845 |
| Mean | $34,449 | $32,114 |
| Median | $32,961 | $33,058 |
| Interquartile 25% (IQ1) | $28,438 | $28,829 |
| Interquartile 75% (IQ3) | $37,095 | $37,011 |
| Interquartile Range (IQR) | $8,657 | $8,182 |
| Standard Deviation (Sample) | $7,858 | $7,697 |
| Standard Deviation (Population) | $7,745 | $7,628 |
Similar Demographics by Median Female Earnings
Demographics Similar to French American Indians by Median Female Earnings
In terms of median female earnings, the demographic groups most similar to French American Indians are Nicaraguan ($36,904, a difference of 0.040%), Immigrants from Dominican Republic ($36,857, a difference of 0.17%), Immigrants from Laos ($36,841, a difference of 0.21%), Immigrants from Venezuela ($37,003, a difference of 0.23%), and Cree ($37,018, a difference of 0.27%).
| Demographics | Rating | Rank | Median Female Earnings |
| German Russians | 0.5 /100 | #263 | Tragic $37,105 |
| Salvadorans | 0.4 /100 | #264 | Tragic $37,083 |
| Immigrants | Belize | 0.4 /100 | #265 | Tragic $37,056 |
| Dominicans | 0.4 /100 | #266 | Tragic $37,046 |
| Immigrants | Nonimmigrants | 0.4 /100 | #267 | Tragic $37,024 |
| Cree | 0.4 /100 | #268 | Tragic $37,018 |
| Immigrants | Venezuela | 0.4 /100 | #269 | Tragic $37,003 |
| French American Indians | 0.3 /100 | #270 | Tragic $36,920 |
| Nicaraguans | 0.3 /100 | #271 | Tragic $36,904 |
| Immigrants | Dominican Republic | 0.3 /100 | #272 | Tragic $36,857 |
| Immigrants | Laos | 0.3 /100 | #273 | Tragic $36,841 |
| Immigrants | El Salvador | 0.2 /100 | #274 | Tragic $36,673 |
| Africans | 0.1 /100 | #275 | Tragic $36,530 |
| Central Americans | 0.1 /100 | #276 | Tragic $36,492 |
| Marshallese | 0.1 /100 | #277 | Tragic $36,459 |
Demographics Similar to Immigrants from Thailand by Median Female Earnings
In terms of median female earnings, the demographic groups most similar to Immigrants from Thailand are Norwegian ($38,802, a difference of 0.020%), Immigrants from Cambodia ($38,833, a difference of 0.060%), Czechoslovakian ($38,738, a difference of 0.19%), Immigrants from Bosnia and Herzegovina ($38,886, a difference of 0.20%), and Aleut ($38,719, a difference of 0.23%).
| Demographics | Rating | Rank | Median Female Earnings |
| Panamanians | 20.6 /100 | #201 | Fair $39,049 |
| Slovaks | 19.9 /100 | #202 | Poor $39,029 |
| Czechs | 18.7 /100 | #203 | Poor $38,992 |
| Immigrants | Uruguay | 17.3 /100 | #204 | Poor $38,945 |
| Immigrants | Colombia | 16.3 /100 | #205 | Poor $38,913 |
| Immigrants | Bosnia and Herzegovina | 15.6 /100 | #206 | Poor $38,886 |
| Immigrants | Cambodia | 14.2 /100 | #207 | Poor $38,833 |
| Immigrants | Thailand | 13.6 /100 | #208 | Poor $38,810 |
| Norwegians | 13.4 /100 | #209 | Poor $38,802 |
| Czechoslovakians | 12.0 /100 | #210 | Poor $38,738 |
| Aleuts | 11.6 /100 | #211 | Poor $38,719 |
| Guamanians/Chamorros | 11.5 /100 | #212 | Poor $38,717 |
| Jamaicans | 10.5 /100 | #213 | Poor $38,670 |
| Iraqis | 10.5 /100 | #214 | Poor $38,666 |
| Spaniards | 10.3 /100 | #215 | Poor $38,656 |