Ghanaian vs Immigrants from Canada Median Household Income
COMPARE
Ghanaian
Immigrants from Canada
Median Household Income
Median Household Income Comparison
Ghanaians
Immigrants from Canada
$83,582
MEDIAN HOUSEHOLD INCOME
27.4/ 100
METRIC RATING
194th/ 347
METRIC RANK
$92,029
MEDIAN HOUSEHOLD INCOME
98.8/ 100
METRIC RATING
88th/ 347
METRIC RANK
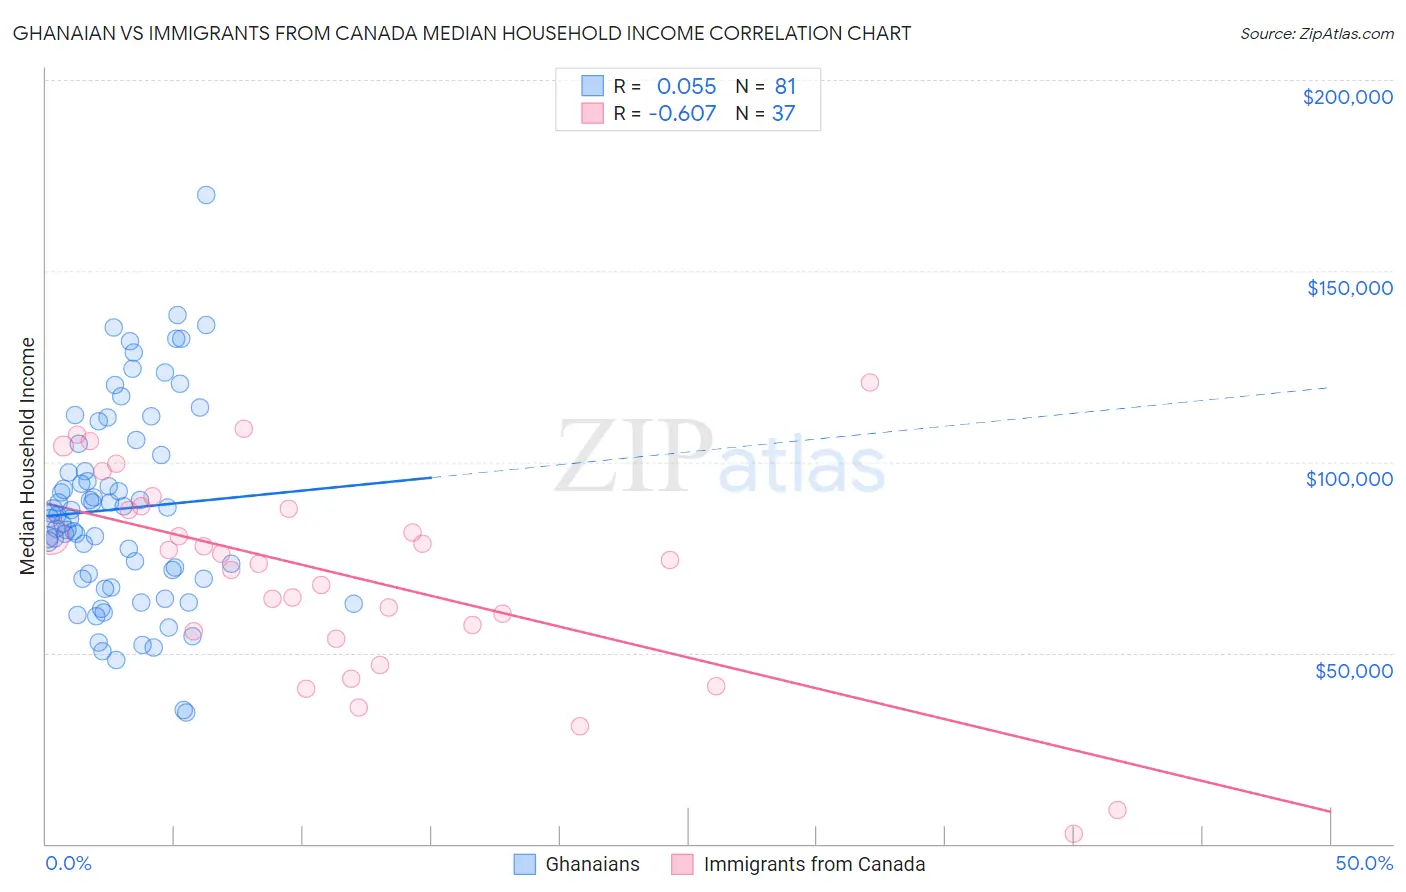
Ghanaian vs Immigrants from Canada Median Household Income Correlation Chart
The statistical analysis conducted on geographies consisting of 190,498,021 people shows a slight positive correlation between the proportion of Ghanaians and median household income in the United States with a correlation coefficient (R) of 0.055 and weighted average of $83,582. Similarly, the statistical analysis conducted on geographies consisting of 459,019,816 people shows a significant negative correlation between the proportion of Immigrants from Canada and median household income in the United States with a correlation coefficient (R) of -0.607 and weighted average of $92,029, a difference of 10.1%.
Median Household Income Correlation Summary
| Measurement | Ghanaian | Immigrants from Canada |
| Minimum | $34,375 | $2,499 |
| Maximum | $169,773 | $120,804 |
| Range | $135,398 | $118,305 |
| Mean | $87,698 | $70,352 |
| Median | $86,122 | $74,400 |
| Interquartile 25% (IQ1) | $69,414 | $54,648 |
| Interquartile 75% (IQ3) | $103,226 | $88,077 |
| Interquartile Range (IQR) | $33,812 | $33,429 |
| Standard Deviation (Sample) | $26,089 | $27,047 |
| Standard Deviation (Population) | $25,928 | $26,679 |
Similar Demographics by Median Household Income
Demographics Similar to Ghanaians by Median Household Income
In terms of median household income, the demographic groups most similar to Ghanaians are Finnish ($83,607, a difference of 0.030%), Immigrants from Armenia ($83,555, a difference of 0.030%), Welsh ($83,628, a difference of 0.060%), French ($83,468, a difference of 0.14%), and Aleut ($83,446, a difference of 0.16%).
| Demographics | Rating | Rank | Median Household Income |
| Belgians | 33.2 /100 | #187 | Fair $84,008 |
| Tlingit-Haida | 32.6 /100 | #188 | Fair $83,968 |
| Immigrants | Colombia | 31.7 /100 | #189 | Fair $83,902 |
| Slovaks | 30.2 /100 | #190 | Fair $83,798 |
| Iraqis | 29.6 /100 | #191 | Fair $83,753 |
| Welsh | 28.0 /100 | #192 | Fair $83,628 |
| Finns | 27.7 /100 | #193 | Fair $83,607 |
| Ghanaians | 27.4 /100 | #194 | Fair $83,582 |
| Immigrants | Armenia | 27.0 /100 | #195 | Fair $83,555 |
| French | 26.0 /100 | #196 | Fair $83,468 |
| Aleuts | 25.7 /100 | #197 | Fair $83,446 |
| Japanese | 25.1 /100 | #198 | Fair $83,395 |
| Germans | 24.6 /100 | #199 | Fair $83,358 |
| Tsimshian | 24.5 /100 | #200 | Fair $83,346 |
| Spanish | 24.4 /100 | #201 | Fair $83,343 |
Demographics Similar to Immigrants from Canada by Median Household Income
In terms of median household income, the demographic groups most similar to Immigrants from Canada are Romanian ($91,994, a difference of 0.040%), Assyrian/Chaldean/Syriac ($91,991, a difference of 0.040%), Immigrants from Vietnam ($91,987, a difference of 0.050%), Immigrants from Hungary ($92,094, a difference of 0.070%), and Immigrants from England ($92,098, a difference of 0.080%).
| Demographics | Rating | Rank | Median Household Income |
| Immigrants | Eastern Europe | 99.4 /100 | #81 | Exceptional $93,051 |
| Immigrants | Spain | 99.3 /100 | #82 | Exceptional $92,732 |
| Italians | 99.1 /100 | #83 | Exceptional $92,475 |
| Immigrants | Argentina | 99.1 /100 | #84 | Exceptional $92,417 |
| Immigrants | Croatia | 99.0 /100 | #85 | Exceptional $92,225 |
| Immigrants | England | 98.9 /100 | #86 | Exceptional $92,098 |
| Immigrants | Hungary | 98.9 /100 | #87 | Exceptional $92,094 |
| Immigrants | Canada | 98.8 /100 | #88 | Exceptional $92,029 |
| Romanians | 98.8 /100 | #89 | Exceptional $91,994 |
| Assyrians/Chaldeans/Syriacs | 98.8 /100 | #90 | Exceptional $91,991 |
| Immigrants | Vietnam | 98.8 /100 | #91 | Exceptional $91,987 |
| Immigrants | Western Europe | 98.8 /100 | #92 | Exceptional $91,936 |
| Immigrants | Lebanon | 98.7 /100 | #93 | Exceptional $91,887 |
| Immigrants | North America | 98.7 /100 | #94 | Exceptional $91,860 |
| Armenians | 98.7 /100 | #95 | Exceptional $91,807 |